User Guide for WiTuners WiFi Site Survey
User Interface
- Menu Items On the Action Bar
- The System Menu
- The Main Screen of Floor
- The Views Submenu
Application Functionality
- Initialize Deployment Floor
- Advised APs and Channels
- AP Details and Moving APs
- Heat Map Visualization
- Detection of Rogue APs
- Site Survey PDF or CSV Report
- Passive Site Survey
- Outdoor Site Survey
- Active Site Survey
- Save and Retrieve Survey Data
- Backup and Recover Data
- Remote Project
- Continuous Site Survey
- Spectrum Analyzer
- Reset Application
- Exit Application
User Interface
The application's main screen has a graphical user interface cotanining menu items on the top action bar and Wi-Fi deployment floor below the action bar. There are slight differences in the user interface and the menu items between the free version and the paid one, depends on the availability of functionality.
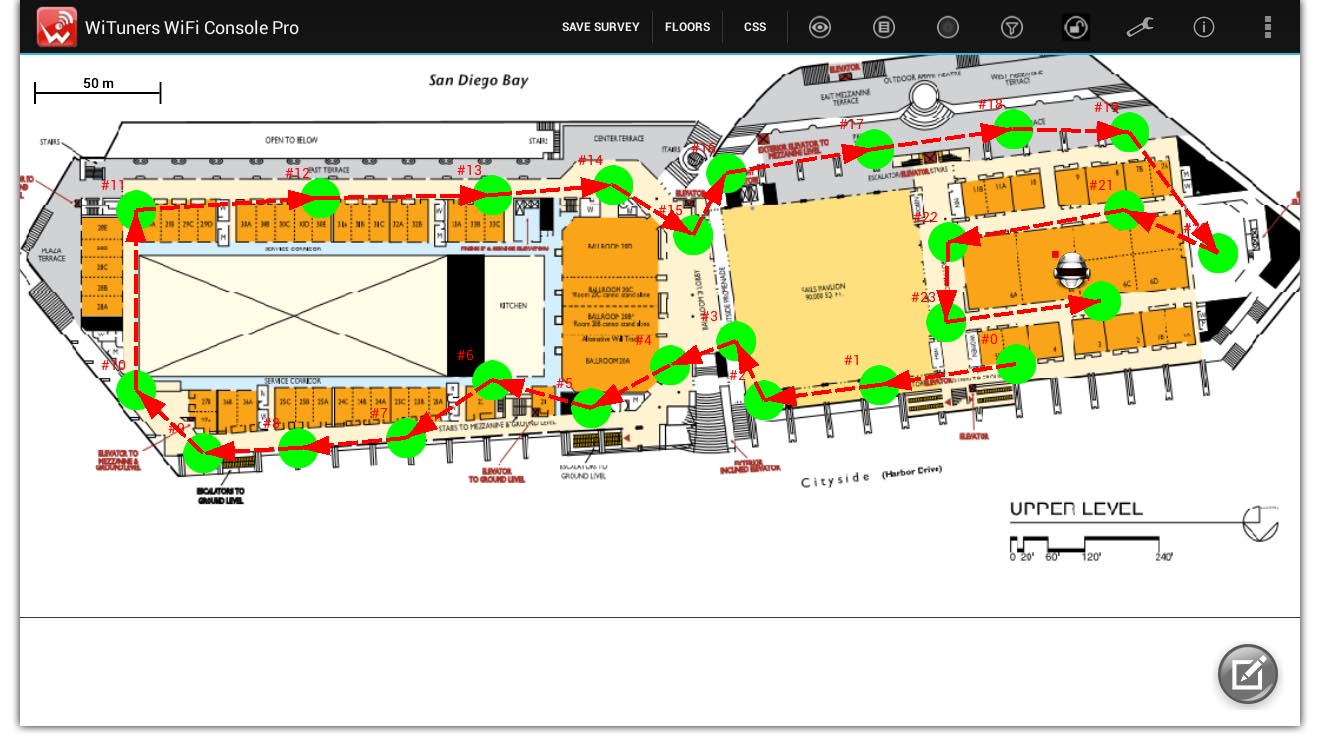
figure 1: Application's main screen
Menu Items On the Top Action Bar
The menu items on the action bar give users a quick way to do a number of most frequently performed tasks.

figure 2: Application's top action bar
 Reference Icon
Tap on this icon, a sub menu will be display with options :"Home" and " Send Report".
- Home
"Home" will lead you to WiTuners home page in your browser.
- Send Report
"Send Report" will open a pop-up dialog for setting an email address where you can send your PDF report to.
 Information Icon
Tap this icon to bring up Information Menu, options in the menu include
- Quick Reference
Tap this sub menu, a pop up dialog will be displayed with set of hints about using the application.
- User Guide
Tap this sub menu, a user guide for using this app will be displayed.
- Tutorial Video
Here you can watch a tutorial video for using this app.
- Send Feedback
Tap this sub menu, a pop up dialog with input text boxes will be displayed to send the custom feedback to WiTuners.
- About
Tap this sub menu, a pop up dialog will be displayed showing the information about WiTuners WiFi Site Survey application and its version information.
 Application Settings Icon
Tap on this icon brings up Application Settings Menu, here you can configure functions available for your WiFi site survey project, options for the settings include.
- Set Filters
- Set Floor Properties
- Set Scan Frequency
- Set Rogue APs
- Set Auto Survey Frequency
- Enable Auto Survey
- Enable Active Survey
- Set Email for Notification
- Set One-Click Server
- Recover Survey Data
- Disable Backup
 Locked/Unlocked Floor Map Icon
This icon is a toggle icon, here you can locked or unlocked the floor map image, when the floor map is unlocked, you can zoom in/out or drag the map for the best view on the floor map.
 Filter Icon
Tap this sub menu, a pop up dialog will be displayed to set filters for APs and WiFi site survey points to display or report.
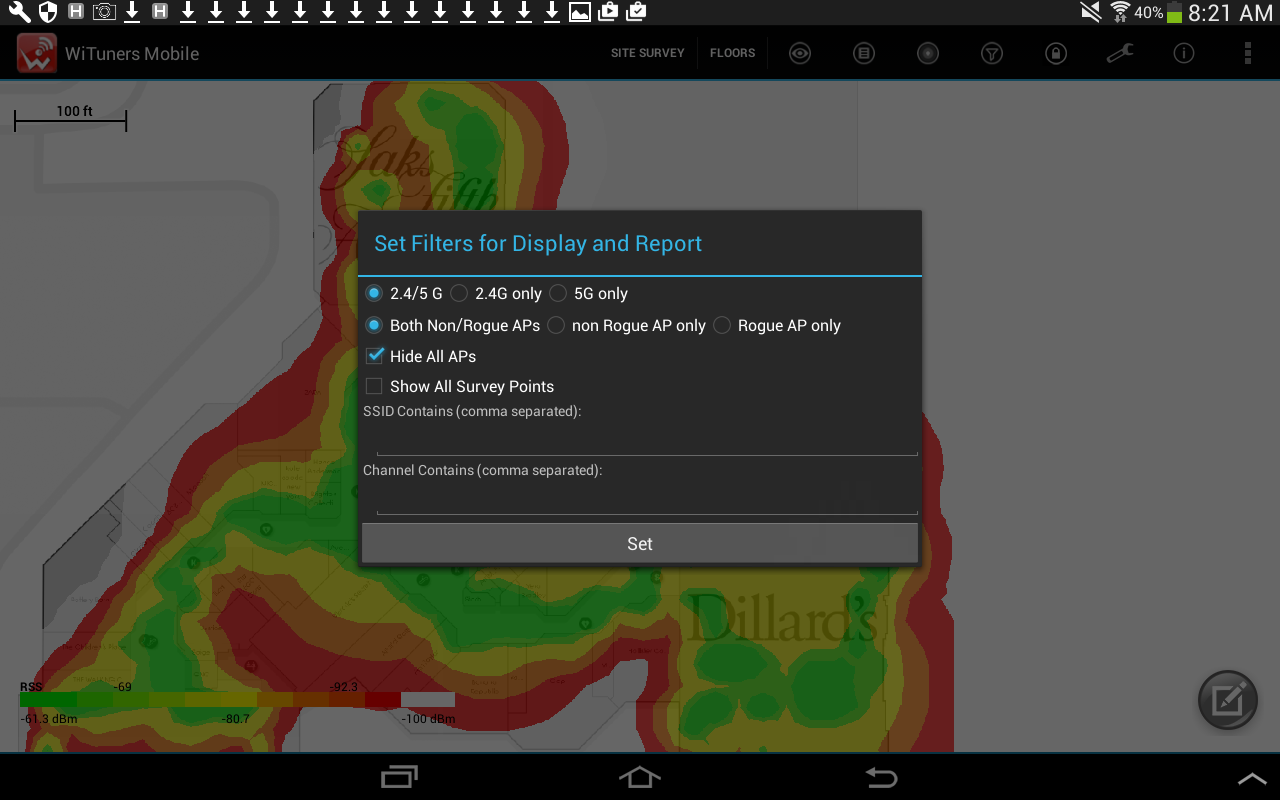
figure 3: the dialog for setting filters
 Heat Map Icon
Heat-map Icon is a checkable toggle icon option. Once it is taped on, the heat map view around each AP will be shown on the deployment panel. Tapping on the option again will hide the heat map view on the deployment panel.
 Generate Report Icon
Tap this icon, the pop up dialog will be display to set up a customized PDF report for your WiFi site survey project
 Views Icon
On Tapping this item, a sub menu will be displayed with a number of WiFi views showing information of the wireless networks from various angles and The System Menu. The options for views include."Summary, AP details", "Channel Use", "WiFi Signal", "APs Per Channel", "Detect Rogue AP" and "The System Menu", please click here to know more.
 Active Survey Icon
Tap this icon to bring up Active Survey Menu, options in the menu include
- Active Survey By Ping
Tapping this sub menu, will be bring up a dialog view for "Active Survey By Bing" test.
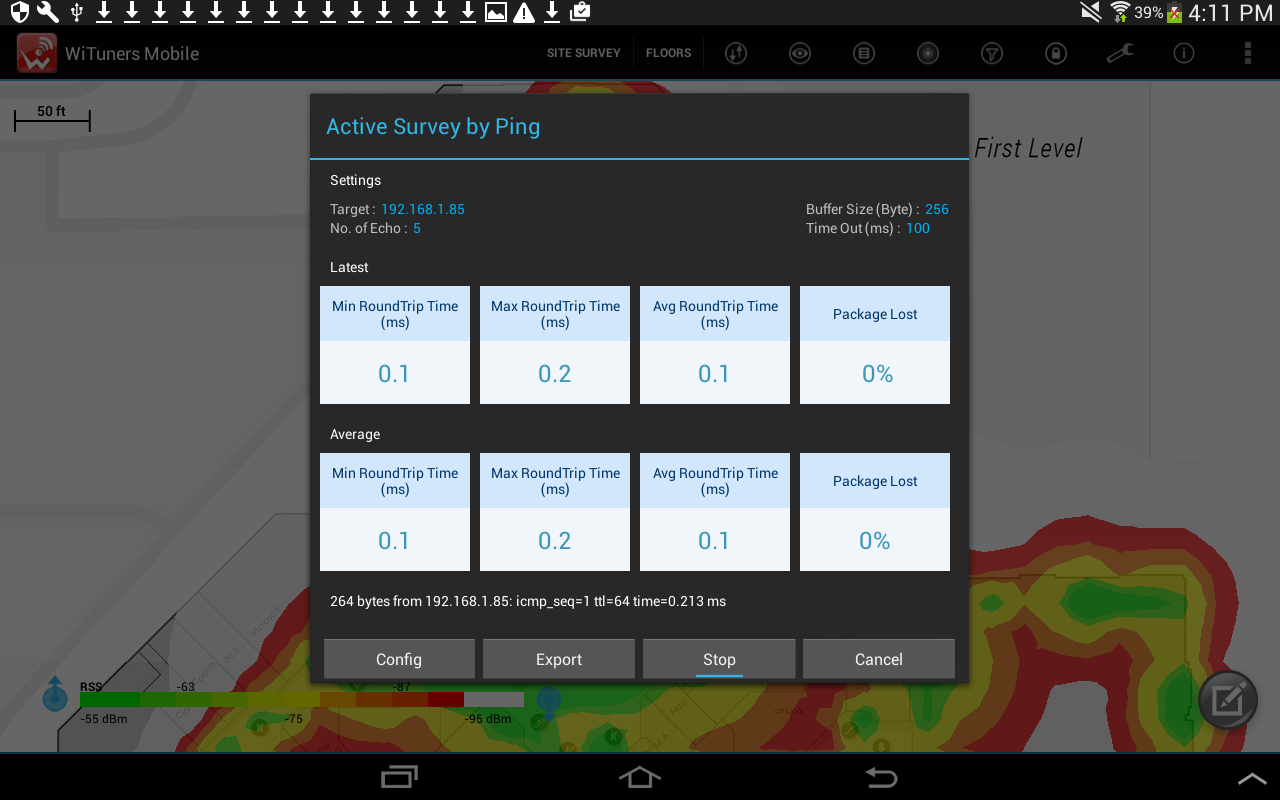
figure 4: Active Survey By Ping
- Active Survey By iPerf
Tapping this sub menu, will be bring up a dialog view for "Active Survey By iPerf" test.
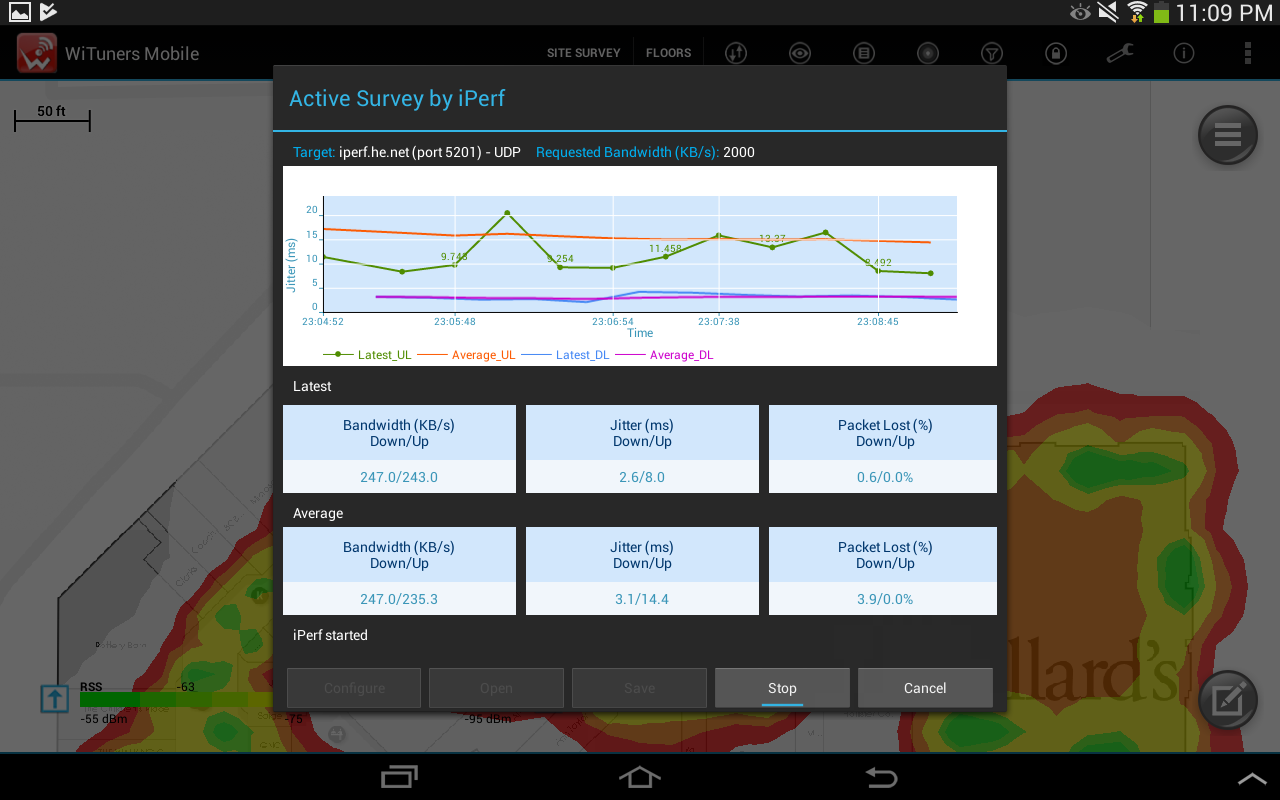
figure 5: Active Survey By iPerf
- Active Survey By FTP
Tapping this sub menu, will be bring up a dialog view for "Active Survey By FTP" test.
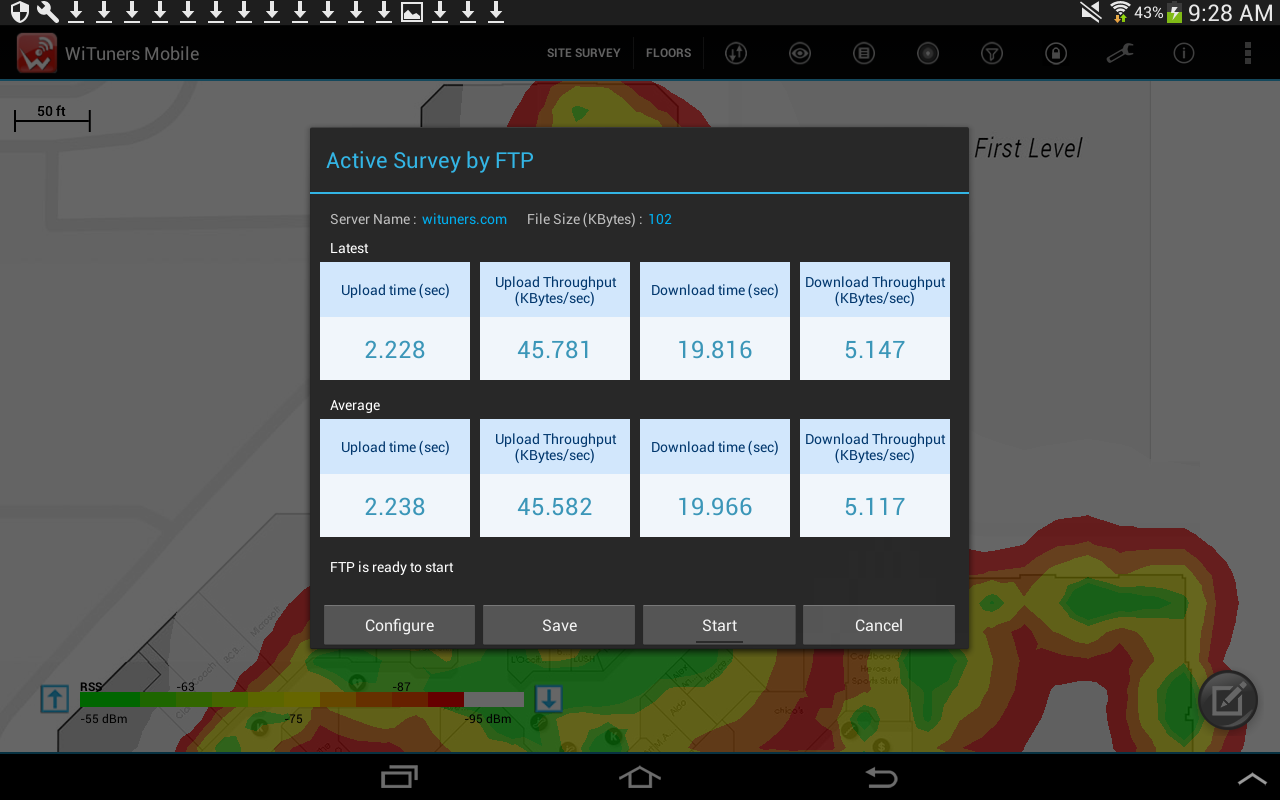
figure 6: Active Survey By FTP
 /
/ Site Survey/Save Survey
This is a two states toggle control item. On tapping this item, the "Site Survey Configuration" dialog will be displayed as below.
figure 7: Site Survey Configuration Dialog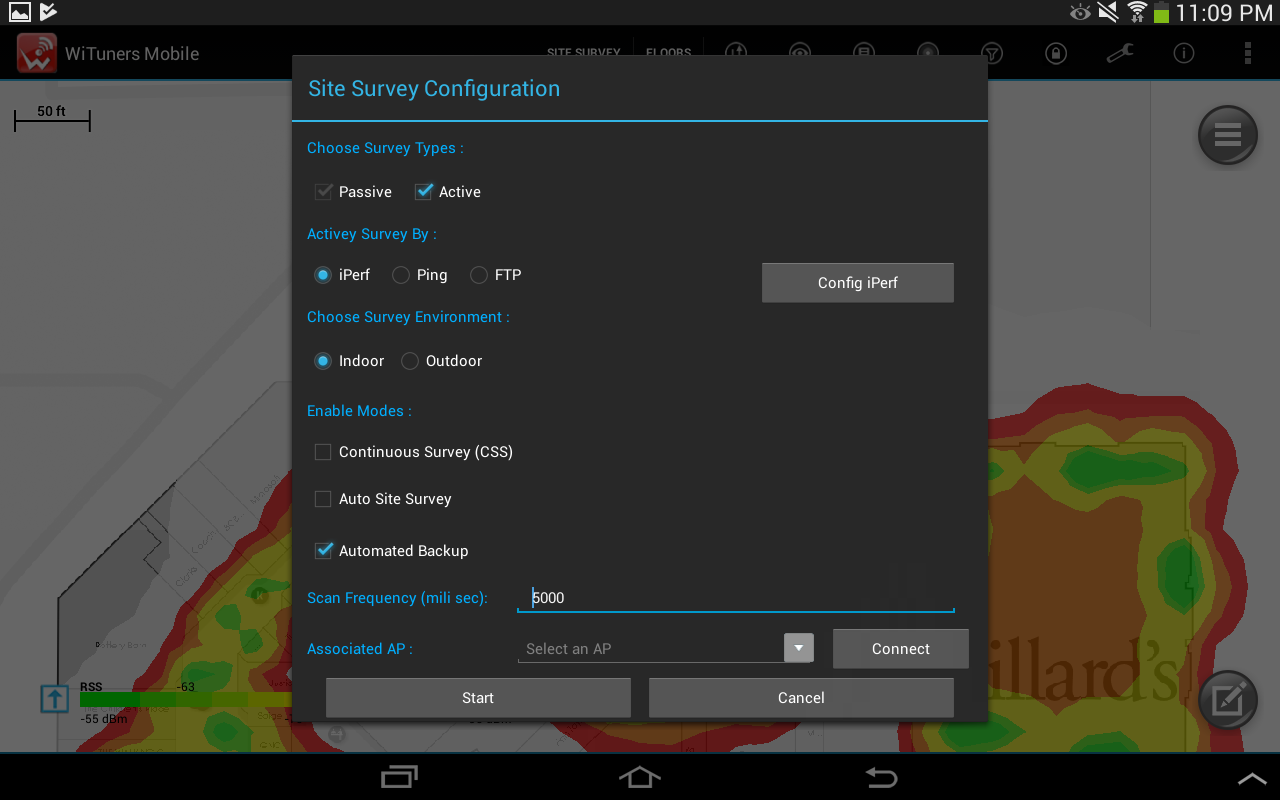
We support both passive site survey and active site survey, when an user check the both options, the site survey will collect both active survey data and passive survey data for every survey point you click in the floor map
When an user select "Active" survey option, there are three of options including active survey by iPerf, Ping and FTP available to click, an user can select one of them to perform active survey.
We support either indoor site survey or outdoor site survey, when an user check "Outdoor" option, the google map will be started loading to on the deployment panel with your tablet connected Internet. Once the GPS signal fixed to your location, the google map will be displayed on your screen, you can tap on the map to move and zoom map, or double tap on it to add survey points to start an outdoor site survey
There are three "Enable Modes" available to select for your site survey:
Continuous Survey(CSS): enable continuous site survey if it is checked
Auto Site Survey: enable auto site survey if it is checked. the site survey points can automatically be added to a floor map in a certain time between two survey points the user clicks.
Automated Backup: enable automated backup for site survey if it is checked.
Clicking "Start" button will start the site surveying function on the floor map displaying the survey robot device and survey point marks when you double tap on the floor map. Tapping the Save Survey control (the toggle state), the survey data will be saved and the site survey function will be stopped. Floors Icon
On tapping the icon, a new dialog will be displayed with a checkable floor map list which you can select a floor map you want to work on your site survey for your multiple floors project from our Remote project.
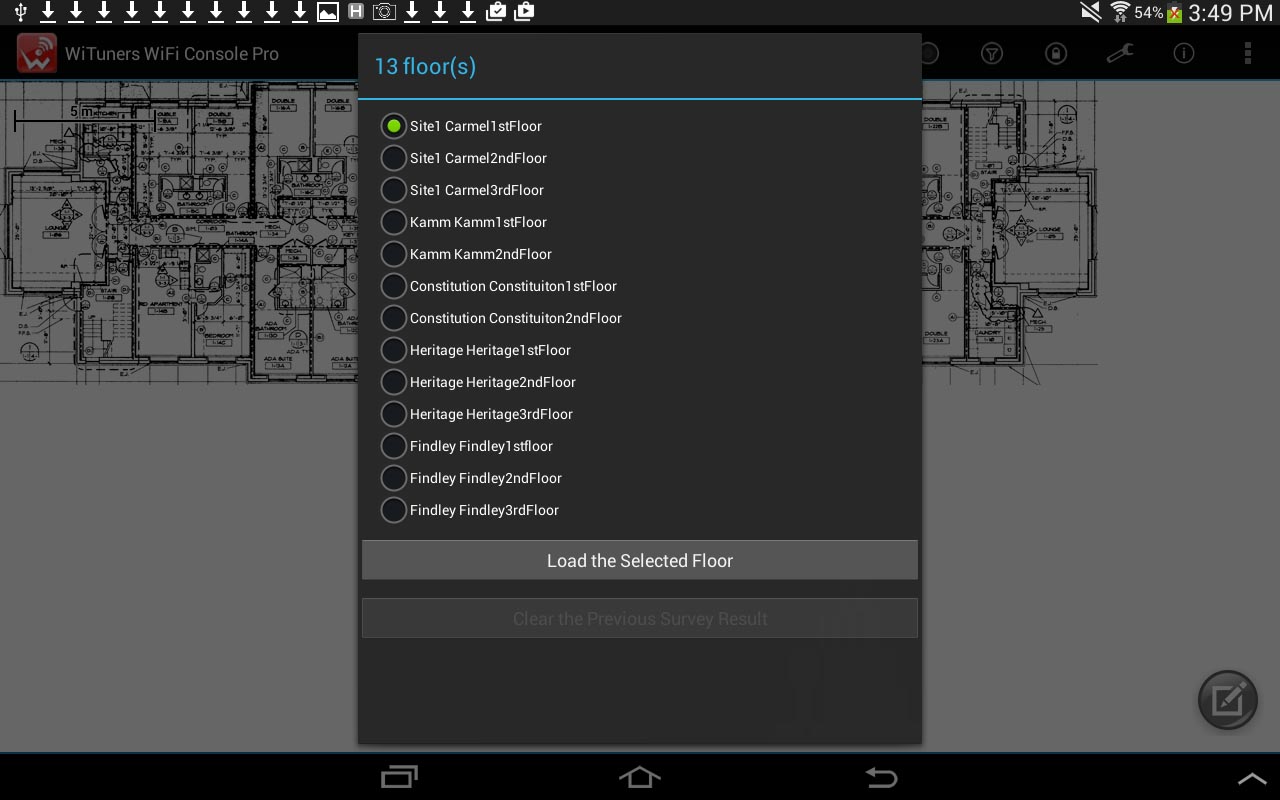
figure 8: a multiple floor list in a Remote Project
Floors Icon will be only shown in the tap bar menu when you get started a site survey
 CSS Icon
Tap this icon to start a continuous site survey(CSS) in period time you can set in a pop up dialog below
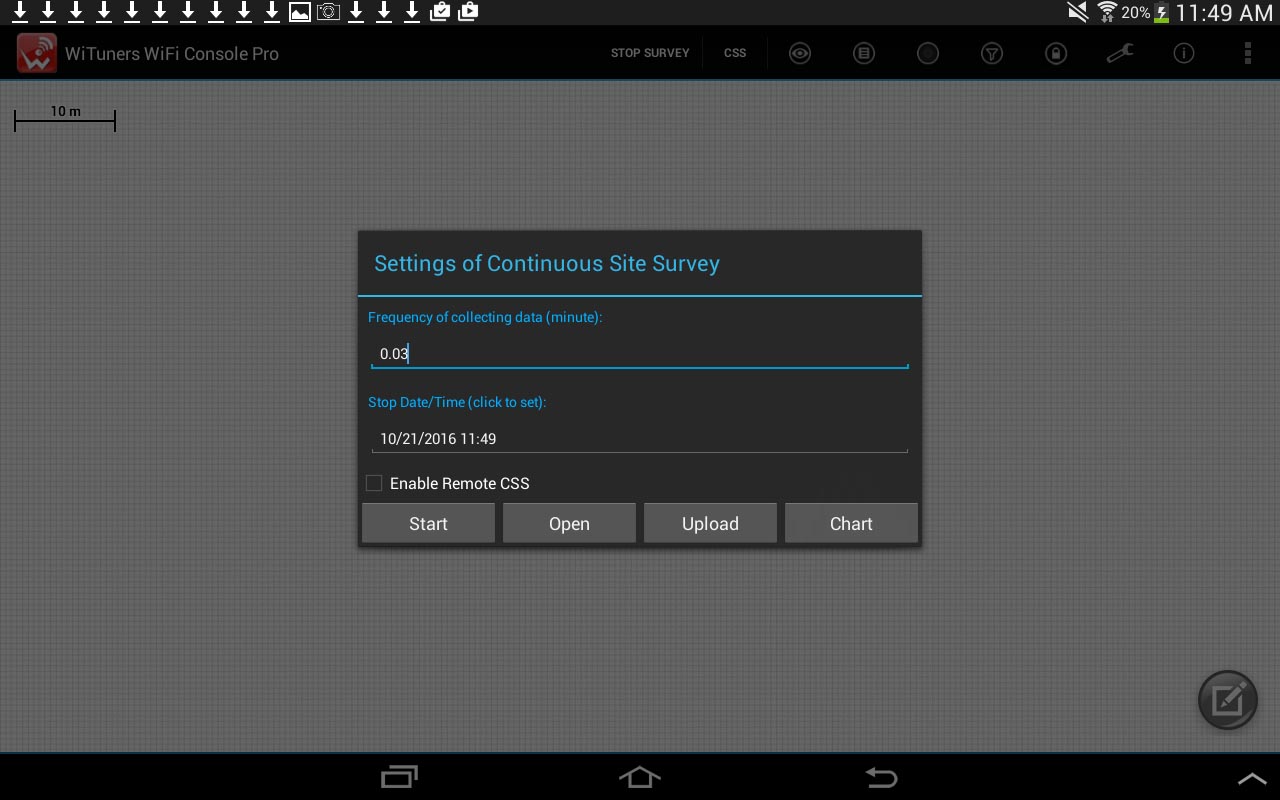
figure 9: a dialog window for starting CSS
After you set to a frequency of collecting data and stop time, then tap "Start" button, CSS window will be displayed on your screen.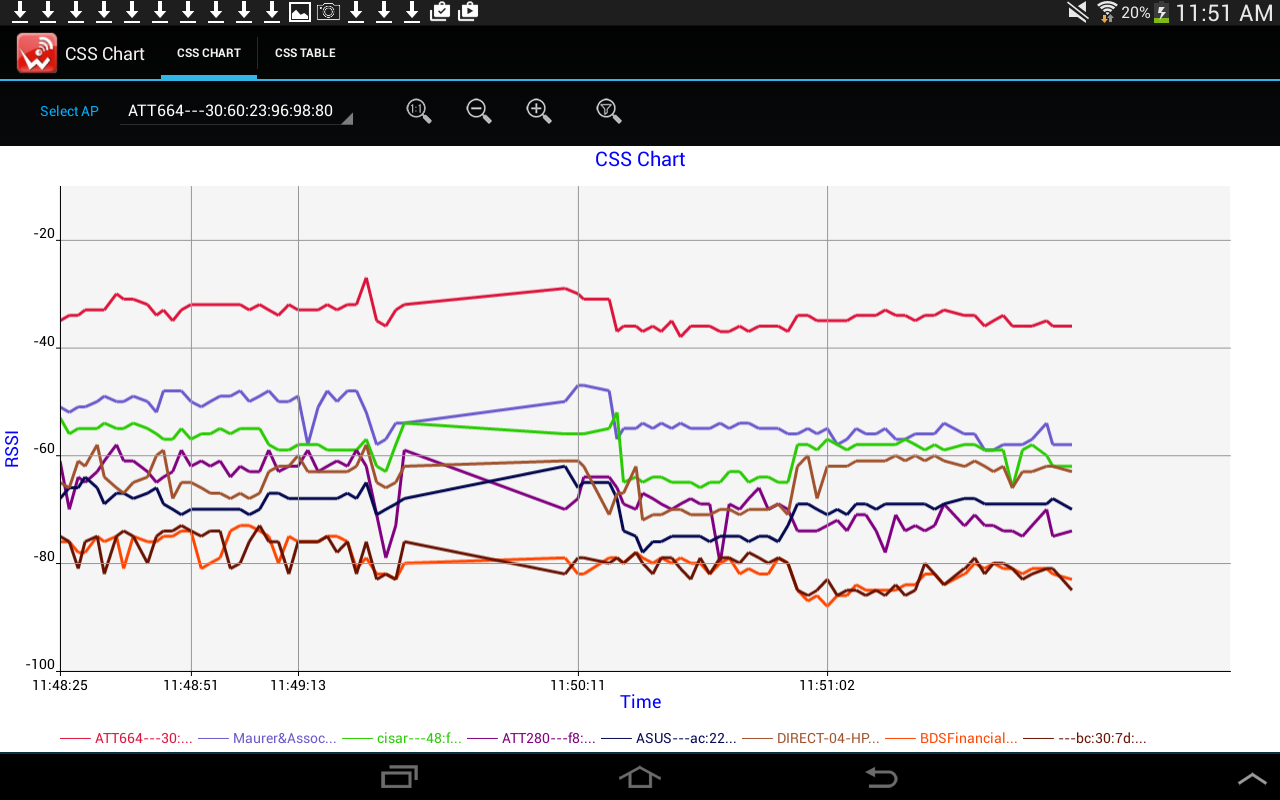
figure 10: CSS chart window
The System Menu
Tap "View" icon then go "System Menu" in top bar menu, or press and hold on the screen to bring up "System Menu" which contains a list of tasks to perform.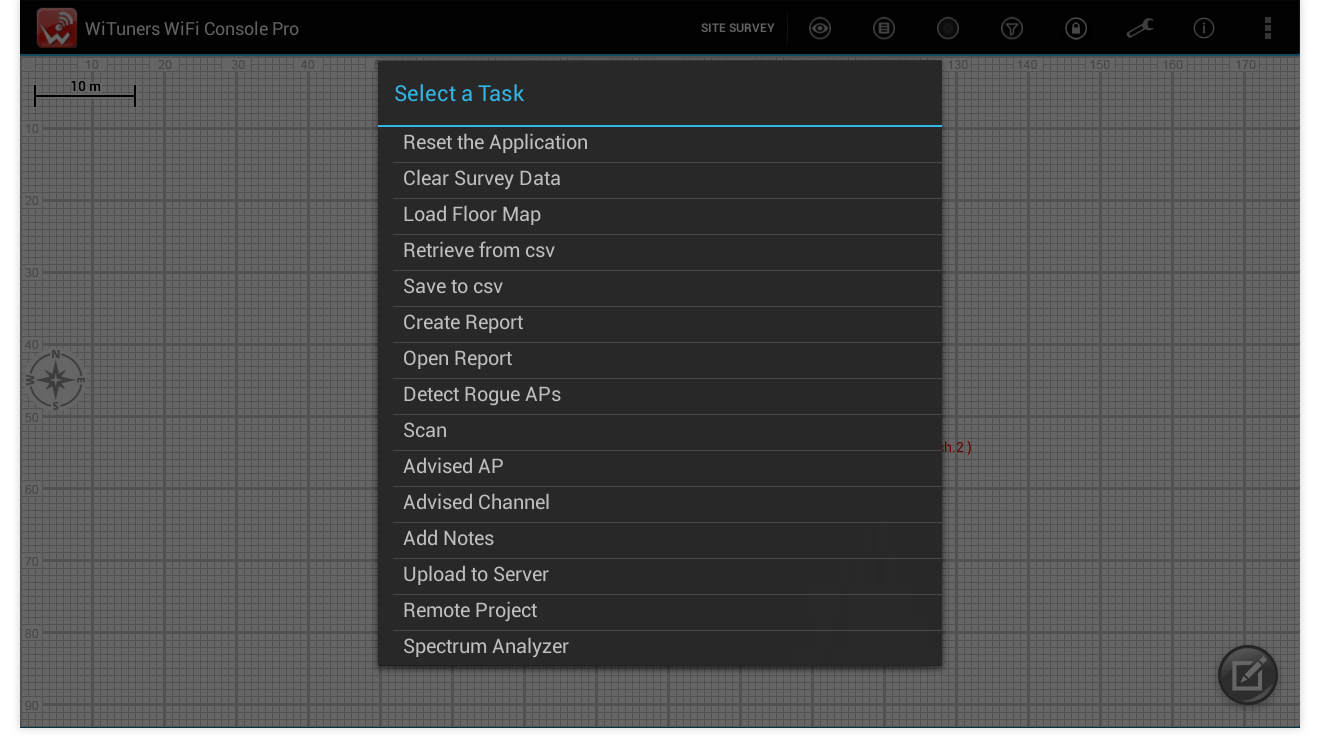
figure 11: Application's System Menu
- Reset the Application
- Clear Survey Data
- Load Floor Map
- Retrieve from csv
- Save to CSV
- Create Report
- Open Report
- Detect Regue APs
- Scan
- Advised AP
- Advised Channel
- Add Notes
- Upload to Server
- Remote Project
- Spectrum Analyzer
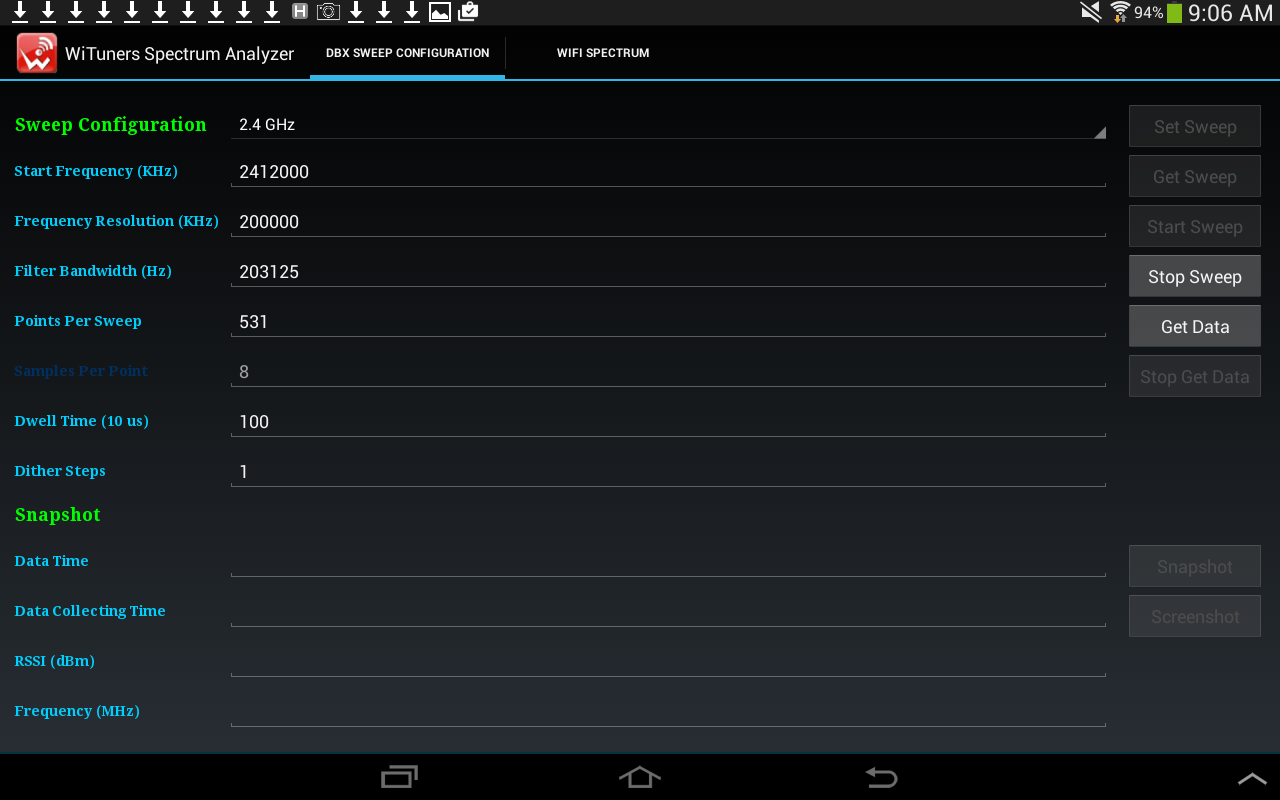
figure 12: Config Spectrum Analyzer
Tap "Set Sweep" to set a RF band, then tap "Get Sweep" to set a start frequency, then tap "Start Sweep" to start a spectrum analysis, a new window will be display to allow you to view a WiFi Spectrum as below.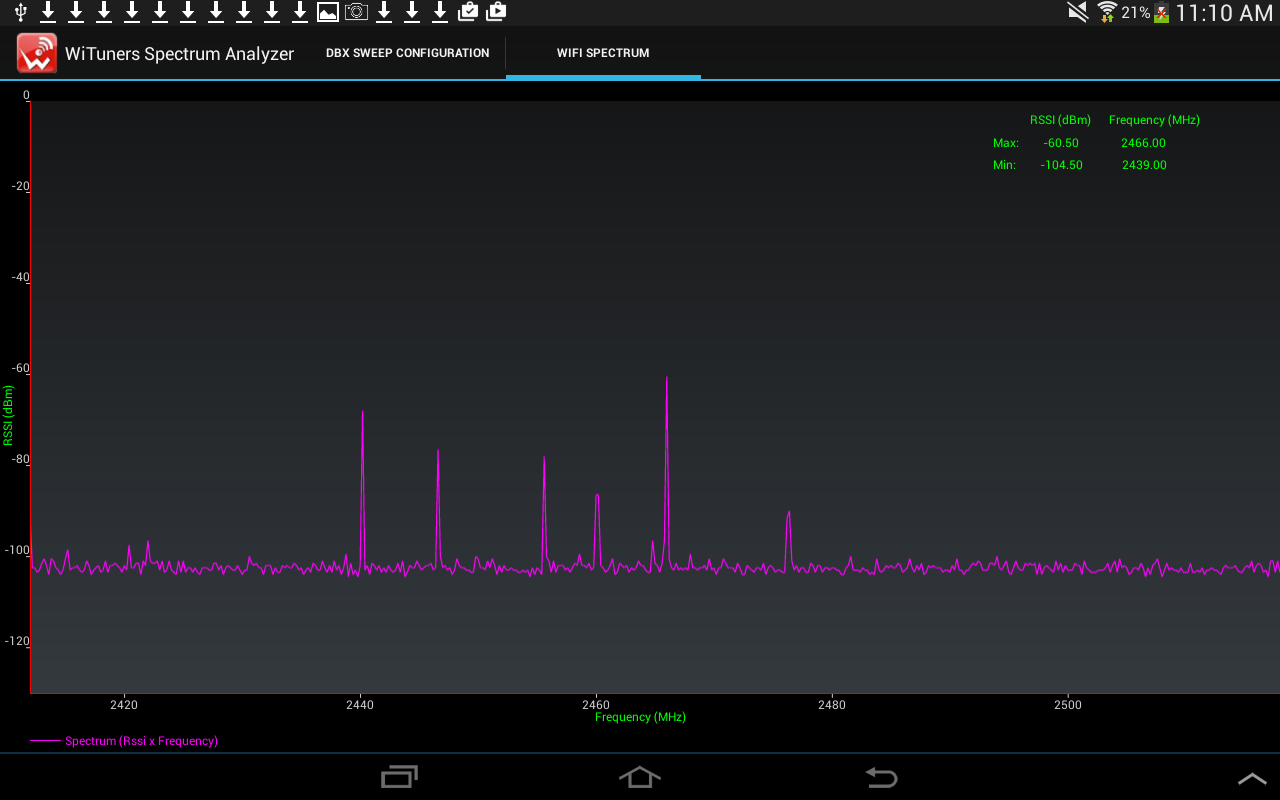
figure 13: WiFi real time spectrum analysis chart
On the top of action bar, there are two tag tables which you can tap one of them to switch WiFi Spectrum View to DBx Sweep Configuration, you can reset configuration, or you can take a screenshot on the WiFi Spectrum View and a snapshot on the specturm data for your PDF report.The Main Screen of the Deployment Floor
The main screen of the deployment floor is located below the action bar.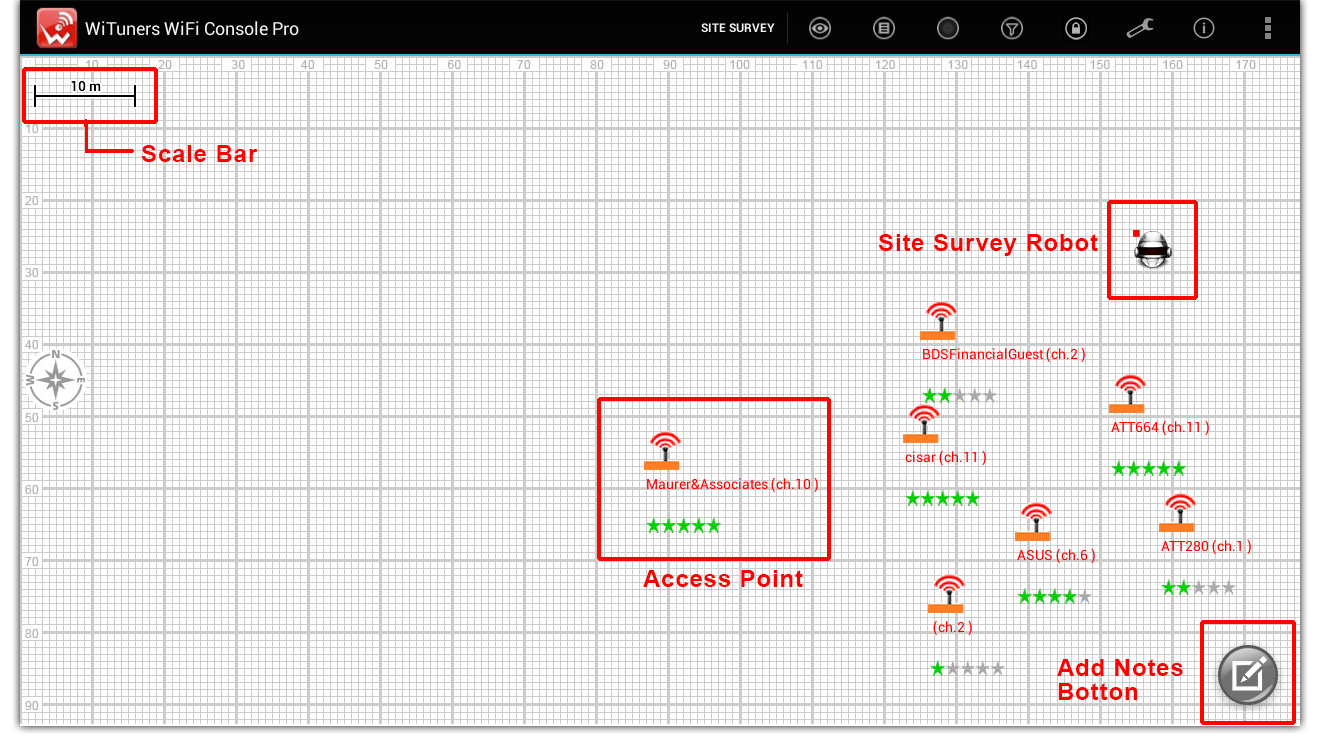
figure 14: the deployment floor
- The deployment floor
- It can display a custom floor map image as a background. Users can zoom in or out the floor map with a two-finger swipe on the screen. Users can also shift the floor map with a one-finger drag on the screen.
- The floor displays the detected access points with signal quality star rating bar, ssid text and channel number; survey location marks (green circles) and survey path (dotted lines connecting circles) and survey robot device.
- Clicking on each icon of AP or survey point on the floor map will display pop up dialogs that will display corresponding information. For example clicking on the AP icon will display a pop up dialog that shows AP information like its SSID, MAC address, frequency, channel number, authentication and encryption details, a connect button to connect to the AP.
- AP icons can be moved around on the screen by dragging and dropping.
- Long clicking on the Floor will open the popup of the The System Menu to select a task.
- The ruler for the scale of a floor map
There is a ruler on the top left of the screen for setting the scale of the floor map, tap it to set the map scale in meters for 100 pixels or by 2 points tapping on the floor map
- The note icon
There is an icon on the bottom right of the screen for adding a note for your site survey into your report if you are on WiFi site survey,tap the icon to open a dialog for adding a note
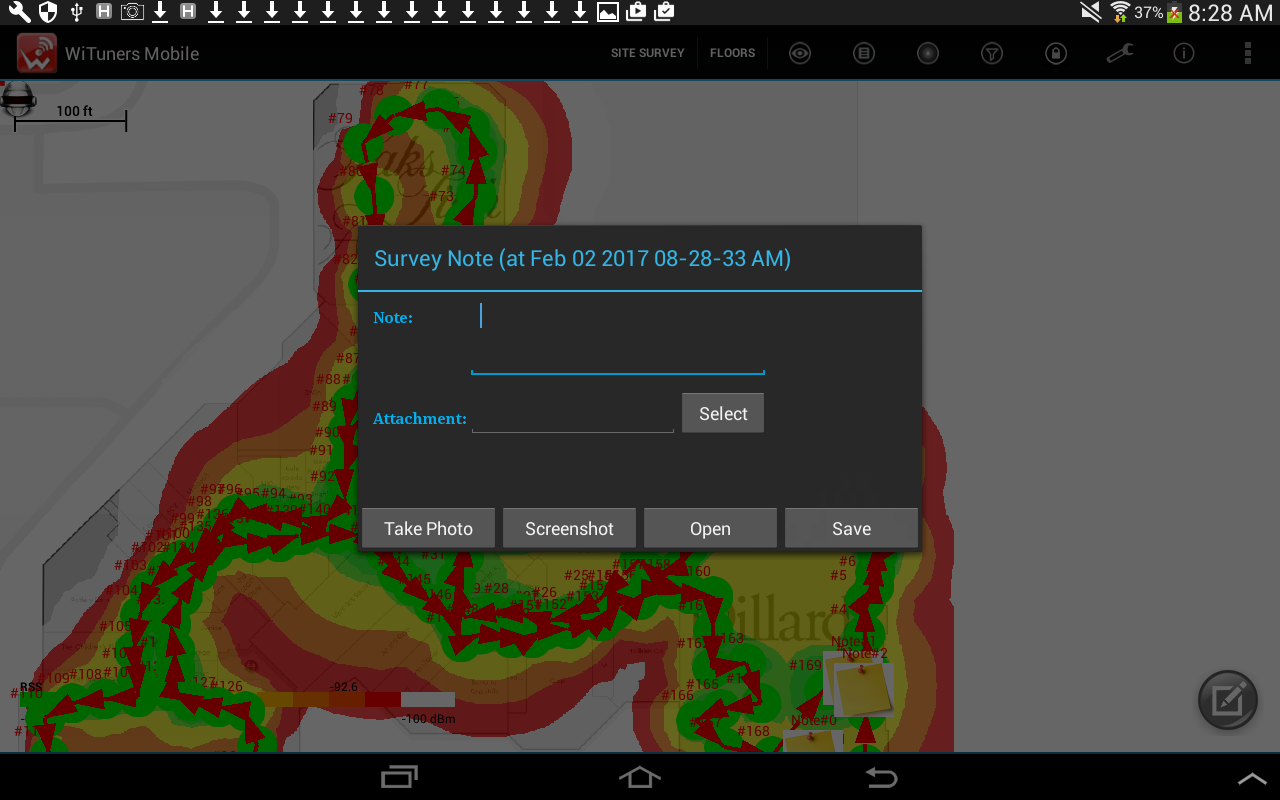
figure 15: setting to add a note
The note could be a text attached with a screen-shot on a current screen, and a photo taken from the camera if it is available on your tablet.
The Views Sub-menu
The views sub-menu shows when selecting "Views" tab from the main screen with a number of WiFi views showing information of the wireless networks from various angles and The System Menu. The options for views include."AP details", "Channel Use", "WiFi Signal", "APs Per Channel", "Detect Rogue AP" and "The System Menu", please click here to know more.
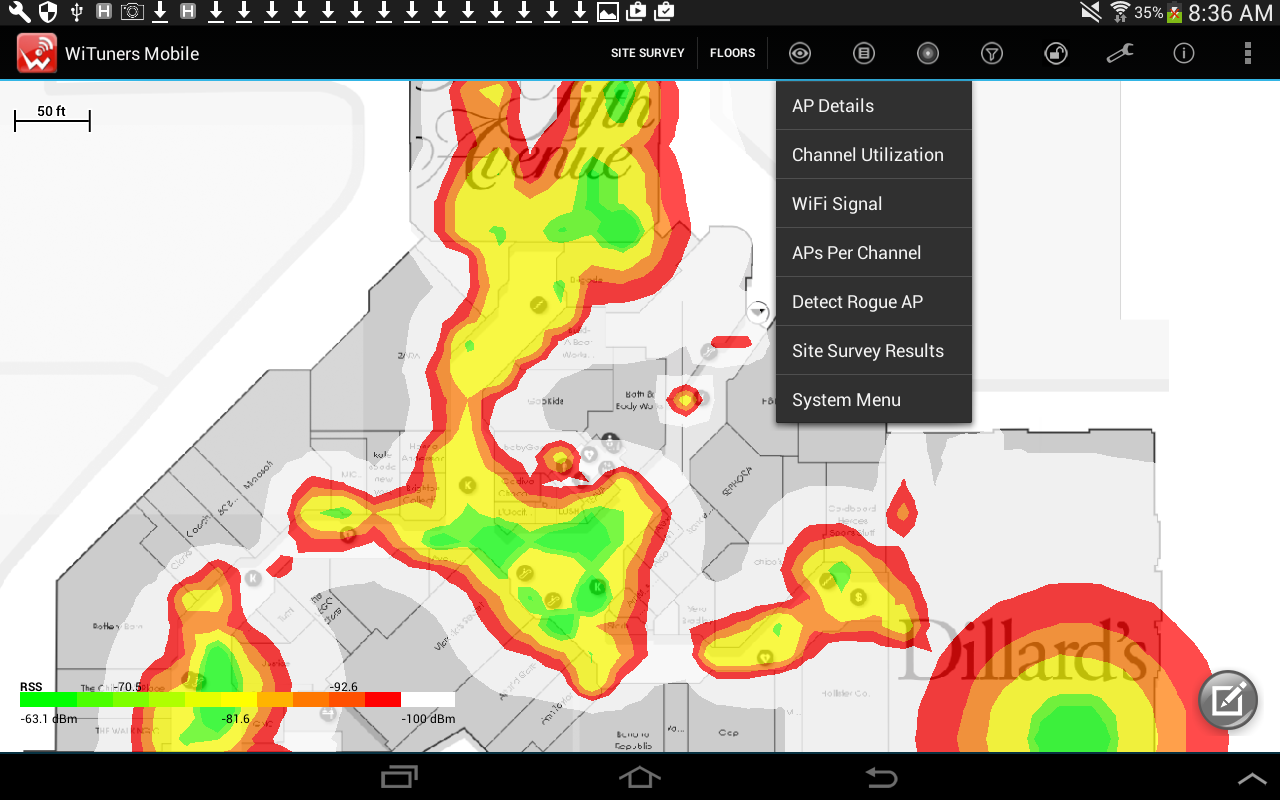
figure 16: the option list for views sub-menu
- AP Details
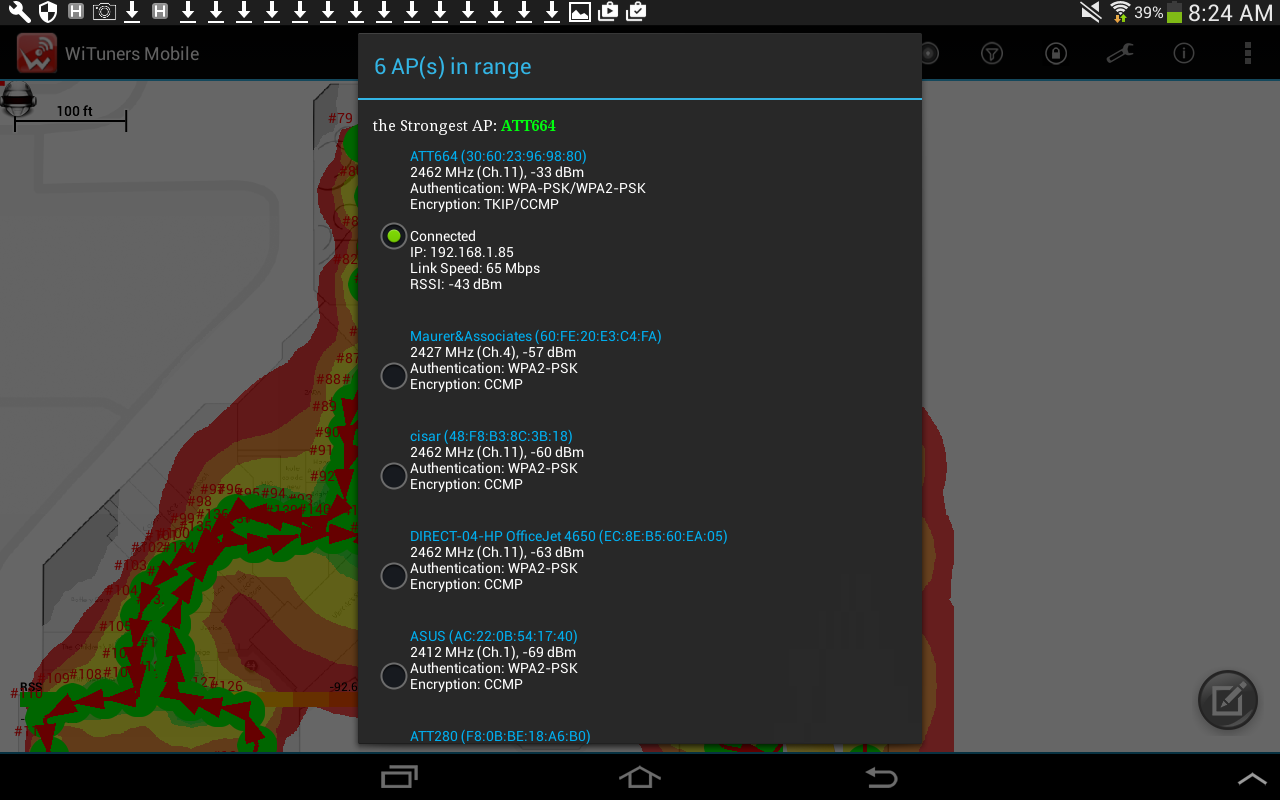
figure 17: AP details
- Channel Use
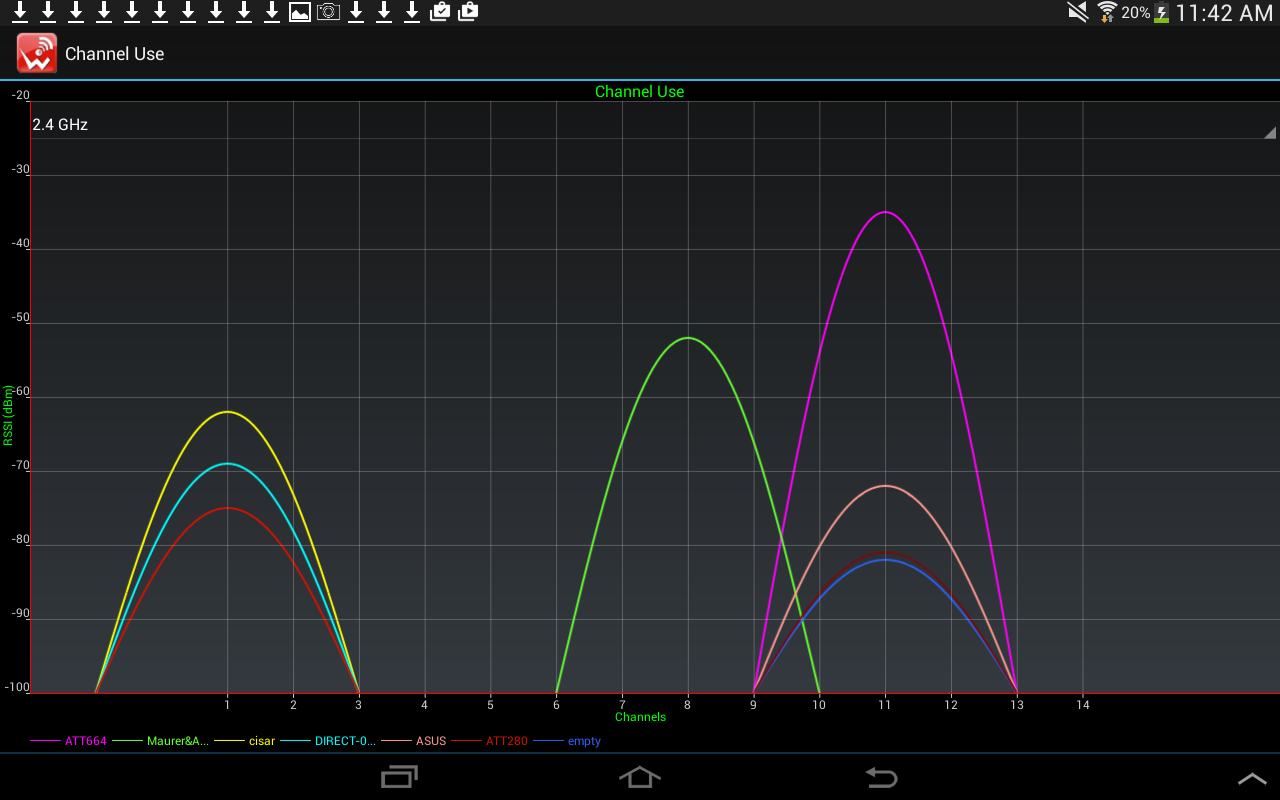
figure 18: the channel usage
- WiFi Signal
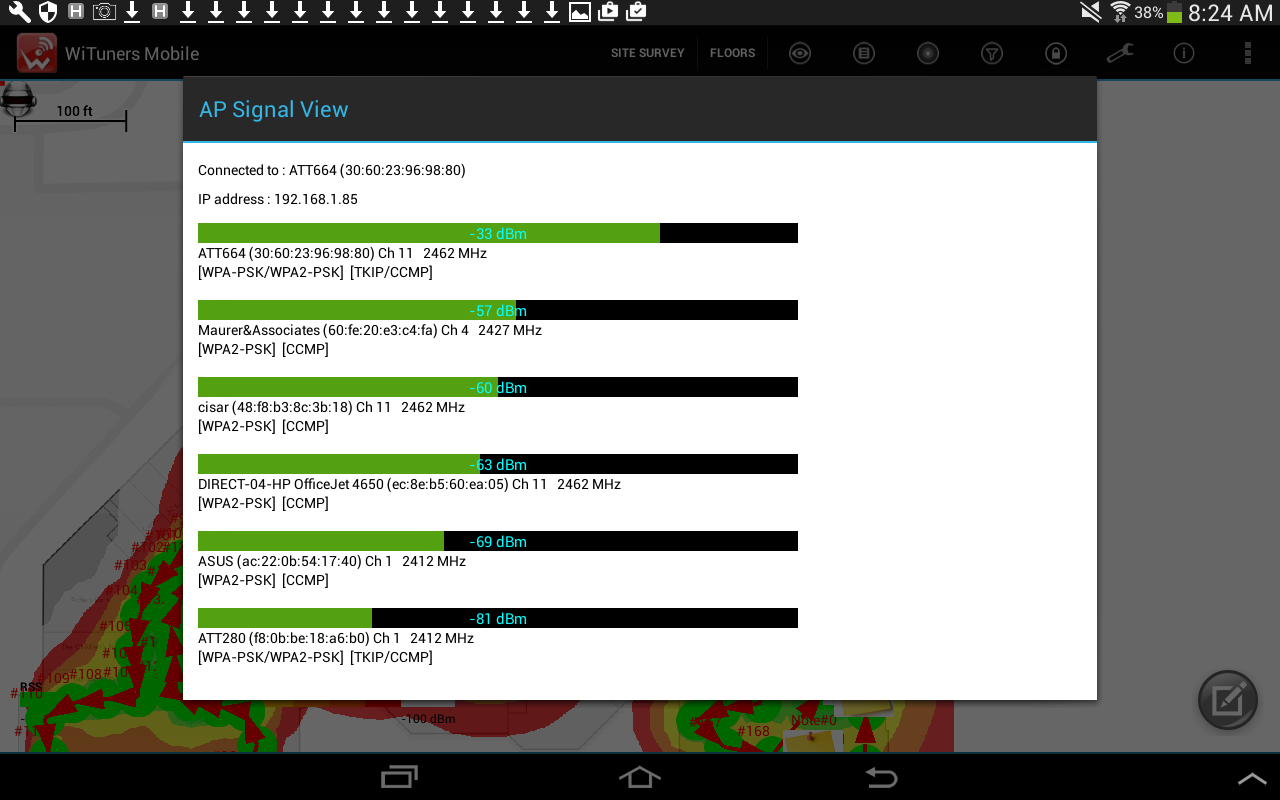
figure 19: WiFi real time signal strength
- APs Per Channel
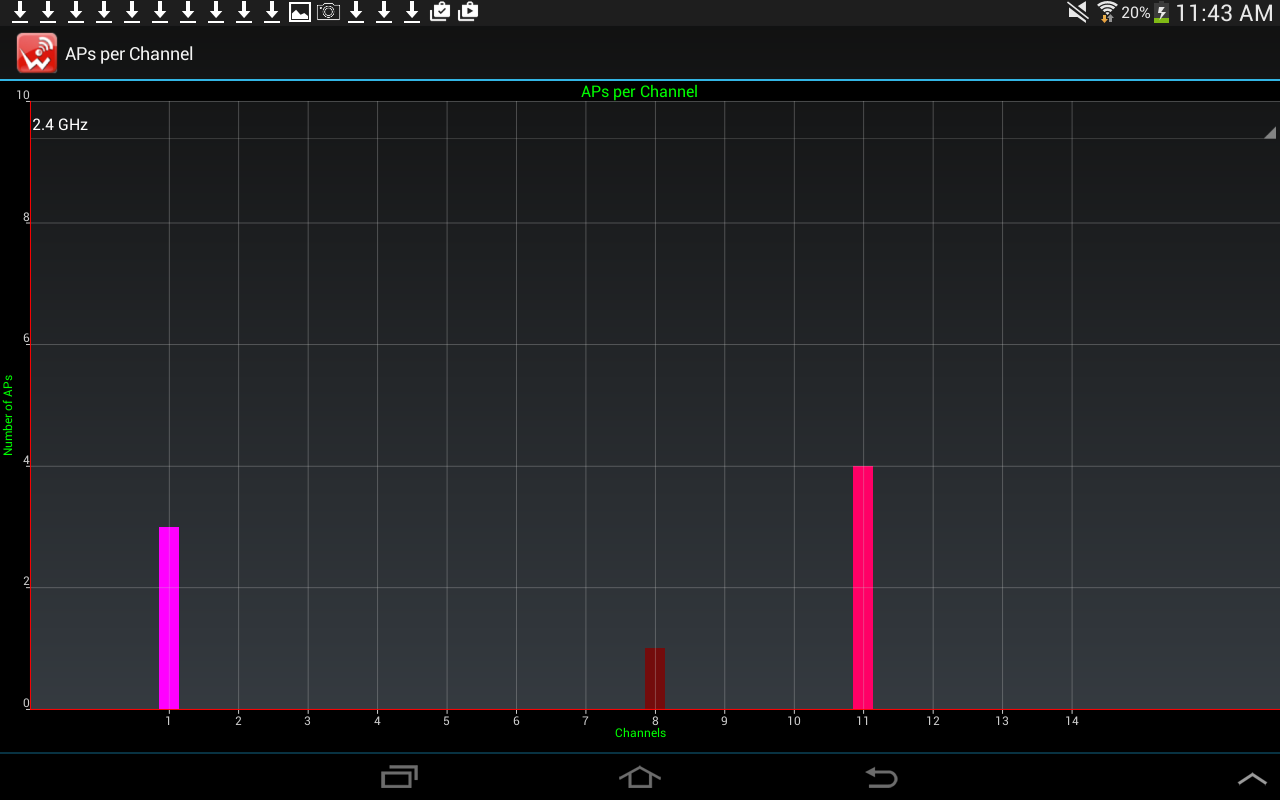
figure 20: APs per channel
- Detect Rogue AP
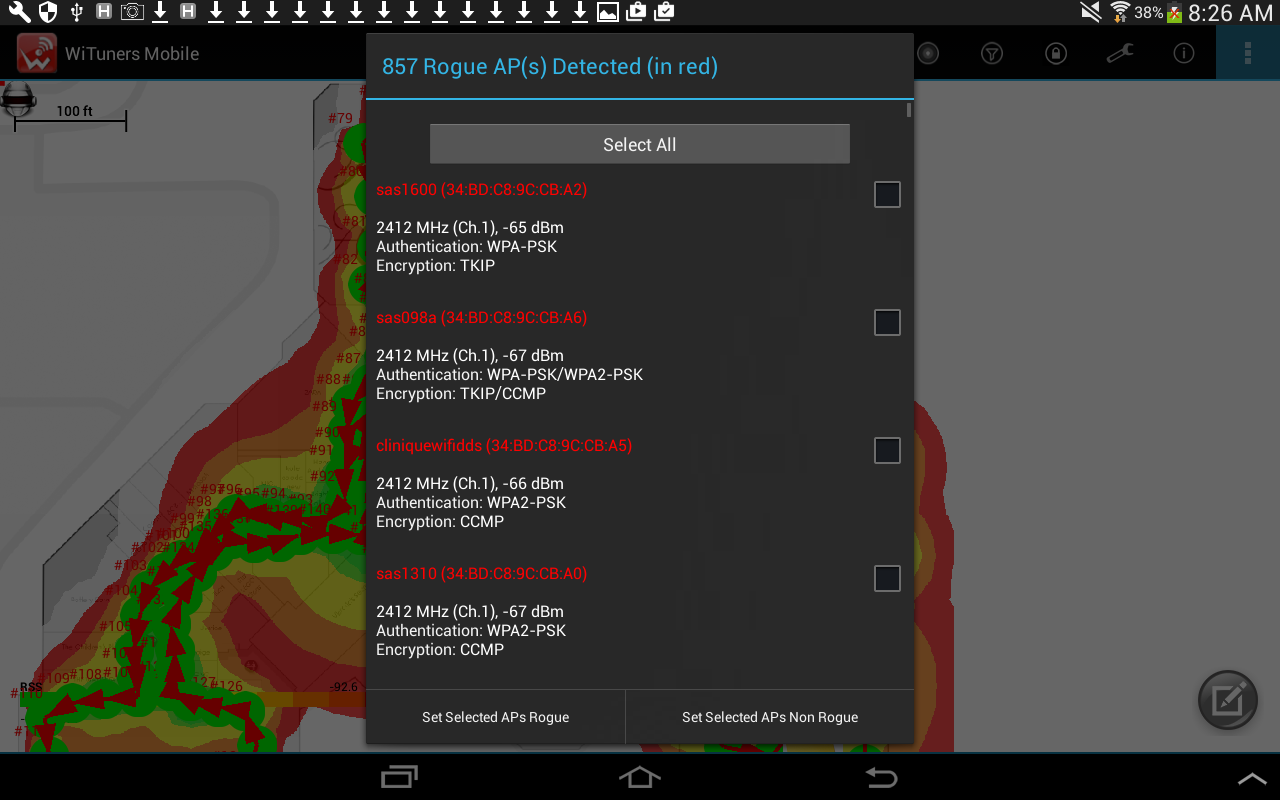
figure 21: The list for detected rogue APs
Tap this item to open "The System Menu", you also may open "The System Menu" through long tap on the screen.Application Functionality
The WiTuners WiFi Surveyor Application is used to perform a mobile site survey of the WiFi networks installed on a particular floor in a building. This is an Android application that runs on Android Smartphones and Tablets those running OS version 3.0 (Honeycomb) and later. This application is targeted to run on Android 4.0 (ICS).
The functions performed by the application have been explained in detail below.
Initializing Deployment Floor
On starting the application, it scans for the access points (APs) in the detectable range and displays the APs on the deployment floor. The deployment floor will have a white grid background as shown in the figure 21. The figure shows 7 APs detected.
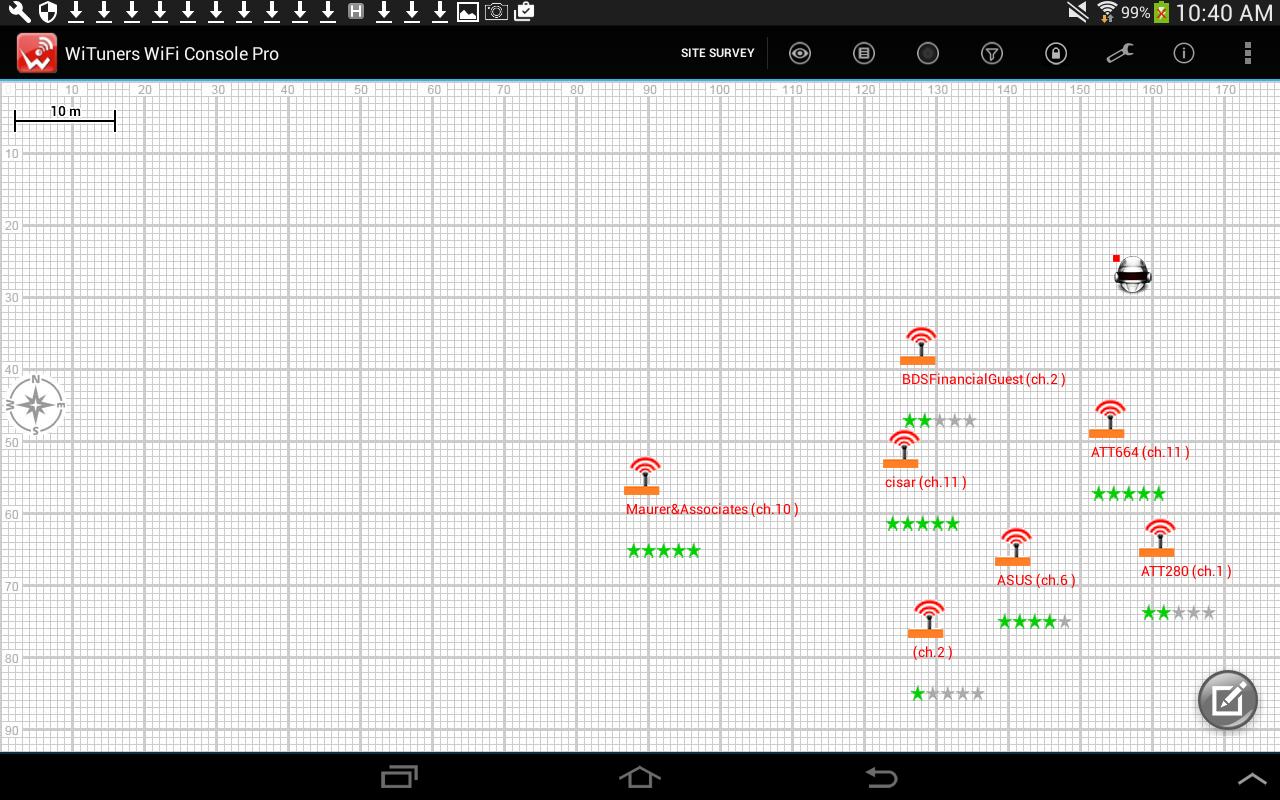
figure 22: the deployment floor on starting the application
The background of the deployment floor can be changed to a custom floor map image. To load a custom floor map image, long click on the deployment floor. The The System Menu with few options will be displayed. Select the option "Load floor map". The file explorer screen will be opened. Navigate to the folder where you have the floor map image to be loaded. Select the file and Click OK to confirm on the pop up confirmation dialog. The selected image gets loaded to the deployment floor
The floor properties such as floor origin, floor height, ceiling height and floor attenuation can be adjusted from their default values. To do this tap on the action bar menu icon ![]() " Application Settings Icon ". A sub menu will be displayed. Click the sub menu option "Set Floor Properties" will display a pop up dialog that has text boxes to enter the floor origin, floor height, ceiling height and floor attenuation parameters. These parameters will have their default values on starting the application.
" Application Settings Icon ". A sub menu will be displayed. Click the sub menu option "Set Floor Properties" will display a pop up dialog that has text boxes to enter the floor origin, floor height, ceiling height and floor attenuation parameters. These parameters will have their default values on starting the application.
These parameters can be edited as per requirements. These parameters will be saved only for the current session of the application. Once the application exits and restarts, these parameters will have their default values and those values are displayed on the text boxes on the pop up dialog.
The scale of the floor map can be entered by clicking on the ruler on the top-left of the deployment floor.
Users can zoom in or out the floor map with a two-finger swipe on the screen. Users can also shift the floor map to a direction with a one-finger drag on the screen. The floor map can be locked to disable its zooming and dragging from the The System Menu.
Finding the Advised Access points and channels
The Advised APs are those APs with good signal quality and less channel congestion. We recommend you should connect to those APs. To find the advised access points on the floor with multiple APs, tap the icon ![]() "Views Icon" on the top action bar to get views submenu,then select "AP details" , the application will scan for access points (APs) in the detectable range and displays a list of Advised APs with radio buttons on a pop up dialog. You can connect to any of the selected advised APs using the Connect button at the bottom of the pop up dialog. If the AP has a secured WiFi network, then a password input dialog will be opened to enter the network password. Once the AP is successfully connected, the connect button will change its text to disconnect.
"Views Icon" on the top action bar to get views submenu,then select "AP details" , the application will scan for access points (APs) in the detectable range and displays a list of Advised APs with radio buttons on a pop up dialog. You can connect to any of the selected advised APs using the Connect button at the bottom of the pop up dialog. If the AP has a secured WiFi network, then a password input dialog will be opened to enter the network password. Once the AP is successfully connected, the connect button will change its text to disconnect.
To find the advised channels, tap on the menu item "ADVISED CH", the application will scan for APs in the detectable range and displays the advised channels information on a pop up dialog. If you are setting up a new WiFi AP or adjusting an existing WiFi AP, set its channel as per the information listed on the pop up dialog.
Getting AP Details and Moving APs on the Floor
It is possible to get the information about all the APs on a pop up dialog. To do this, click the menu option the icon ![]() "Views Icon" on the top action bar to get views submenu,then select "AP details", then a pop up dialog will be displayed with information about all the access points with a radio button to select a particular AP. You can connect to the selected WiFi AP using the Connect button at the bottom of the pop up dialog. If the AP has a secured WiFi network, then a password input dialog will be opened to enter the network password. Once the AP is successfully connected, the connect button will change its text to disconnect.
"Views Icon" on the top action bar to get views submenu,then select "AP details", then a pop up dialog will be displayed with information about all the access points with a radio button to select a particular AP. You can connect to the selected WiFi AP using the Connect button at the bottom of the pop up dialog. If the AP has a secured WiFi network, then a password input dialog will be opened to enter the network password. Once the AP is successfully connected, the connect button will change its text to disconnect.
figure 23: the list for APs details
It is possible to get the information about each individual AP placed on the floor. Just touching the AP icon will display a pop up dialog that has all the information corresponding to the tapped AP. The information contains AP SSID, AP BSSID (MAC Address), frequency, channel number, signal level, authentication and encryption type supported by the access point. The APs are rated using a rating bar (with green color stars). The rating is based on dBm value of RSSI (signal level) of the AP. 5 stars for dBm > -60, 4 stars for dBm > -65, 3 stars for dBm > -70, 2 stars for dBm > -75, 1 star for dBm < -75.
The AP can be moved on the floor map to a new location. To move an AP, long click on the AP icon and drag to the new location on the floor map where you want to place the AP. The AP information dialog has a Connect/Disconnect toggle button to connect to the selected AP. Just click on the Connect button, if the AP has a secured WiFi network, then a password input dialog will opened to enter the network password. Enter the password and select the key number and key type Ascii/Hex for WEP authentication. Enter the password alone for WPA authentication and click OK. If the authentication succeeds, the WiFi network will be connected and active with that associated AP.
Heat Map Visualization
The heat map displayed on the deployment panel around each AP represents the RF power distributed by the corresponding AP if there is no site survey points. If there is site survey points, the heatmap will be displayed for each site points.
- Turn on/off a heat map
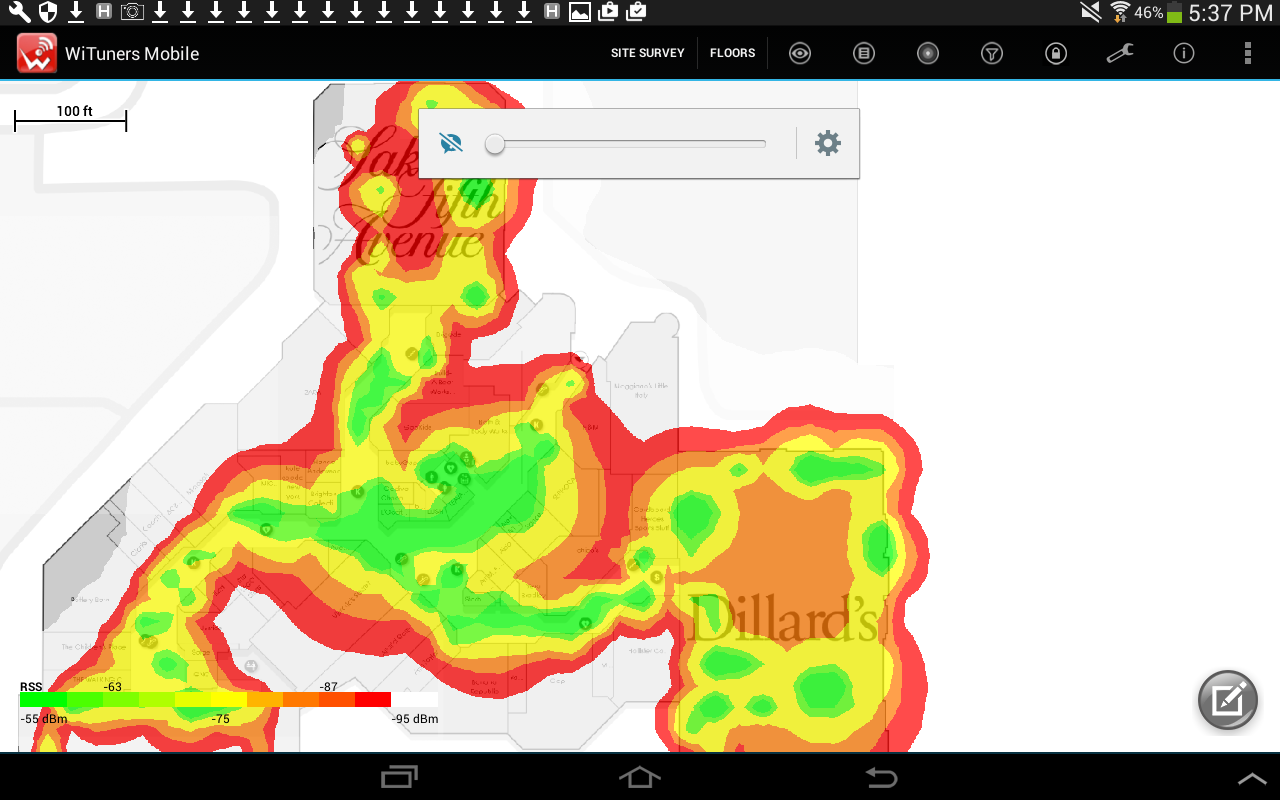
figure 24: heat map for site survey points
- Configurations for heat map indication
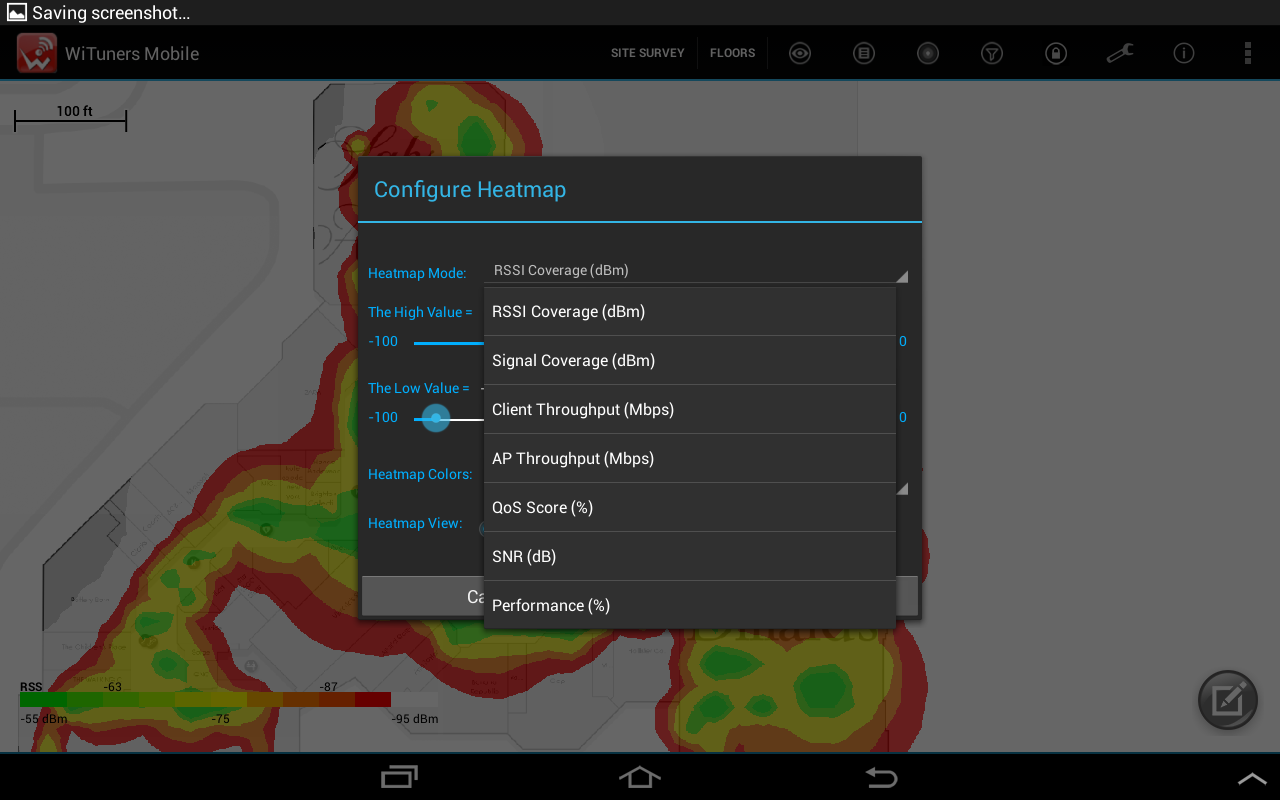
figure 25: configuration dialog for heat-map visualization
There are 7 different options available for the heat-map, including in RSSI Coverage, Signal Coverage, Client Throughput, AP throughput, QoS Score, SNR, and Performance, the high value and the low value for each heapmap also are available to set in heapmap visualization.Setting up and Detection of Rogue Aps
The access points which are known to cause a security threat can be set as rogue. There are 2 ways by which you can set the Rogue APs. One way is by importing the Rogue AP list. If you have a list of known rogue APs, you can import the list with an option in the Application Settings. To import the rogue AP list, add the MAC address of the rogue APs per line in a text file and put the text file to the sdcard in a known path and click the menu option ![]() " Application Settings Icon ", click the sub menu option "Set Rogue Aps", a pop up will be displayed with 3 buttons. Click the import button and browse to select the Rogue AP List text file in the sdcard. The rogue APs will be added to the application database, so that if the same APs are detected in the WiFi scan, then those APs will be alerted as rogue.
" Application Settings Icon ", click the sub menu option "Set Rogue Aps", a pop up will be displayed with 3 buttons. Click the import button and browse to select the Rogue AP List text file in the sdcard. The rogue APs will be added to the application database, so that if the same APs are detected in the WiFi scan, then those APs will be alerted as rogue.
figure 26: the list for detected rogue APs
You can also set the Rogue APs by tapping ![]() "Views Icon" on the top action bar to get views submenu,"Detect Rogue AP" in the VIEW menu. It will display a pop up dialog that lists the access points detected. The access points which are known to cause a security threat can be marked as rogue. APs that were marked as rogue already can be marked as non-rogue with this option. The ssid text of a rogue AP is displayed in red color and non-rogue APs in green color, on the Rogue AP view pop up dialog. Now you can export this rogue APs to a text file on the sdcard. Click the Export button on "Set Rogue APs" pop up dialog and enter the file name to export to sdcard.
"Views Icon" on the top action bar to get views submenu,"Detect Rogue AP" in the VIEW menu. It will display a pop up dialog that lists the access points detected. The access points which are known to cause a security threat can be marked as rogue. APs that were marked as rogue already can be marked as non-rogue with this option. The ssid text of a rogue AP is displayed in red color and non-rogue APs in green color, on the Rogue AP view pop up dialog. Now you can export this rogue APs to a text file on the sdcard. Click the Export button on "Set Rogue APs" pop up dialog and enter the file name to export to sdcard.
Generating Customized Report and Pre-configured Emails
- Generate customized report
Tap ![]() Generate Report Icon, the pop up dialog will be display to set up a customized PDF report for your WiFi site survey project
Generate Report Icon, the pop up dialog will be display to set up a customized PDF report for your WiFi site survey project
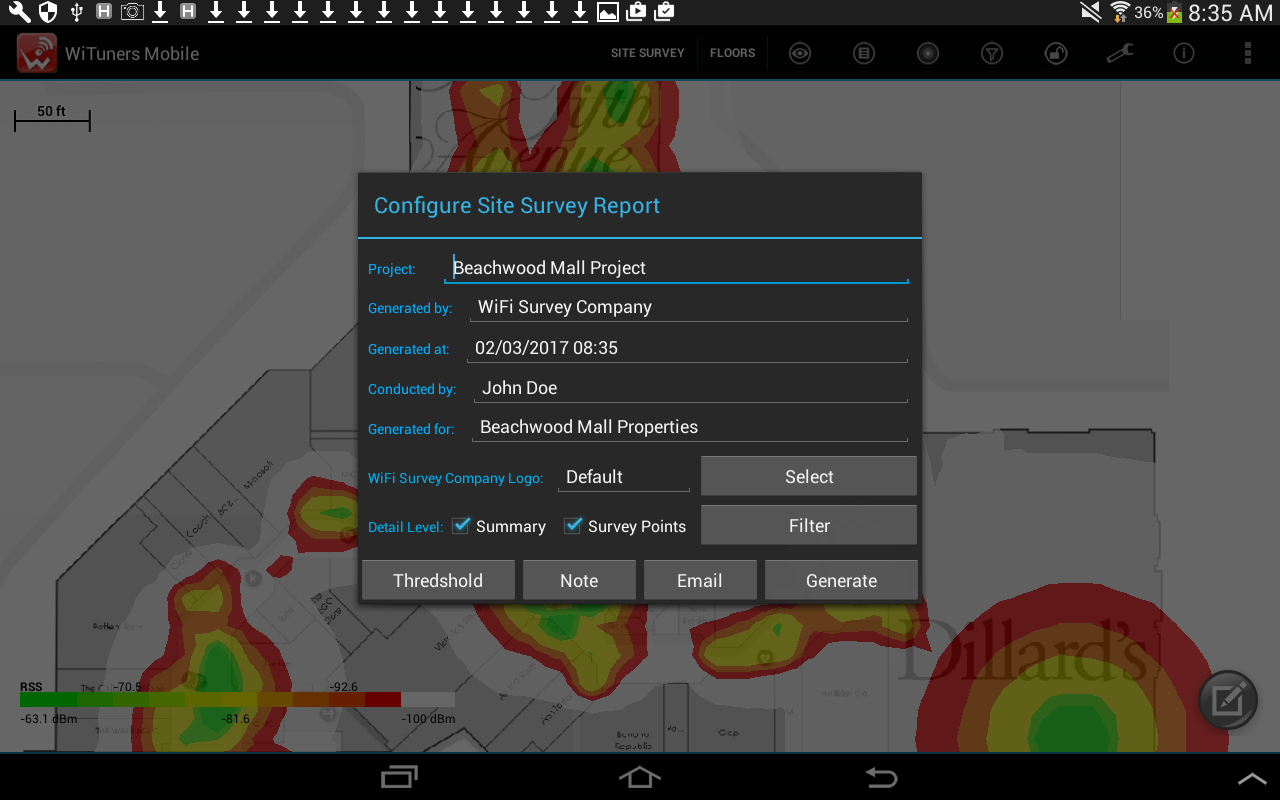
figure 27: the dialog window for customized PDF or CSV report configuration
The PDF report includes:
- Customizable with your own cover images
- Customizable with your project information
- Customizable with your company or clients' logos
- Table of Content for quick access of your particular survey information
- Comprehensive details for the site survey results
- Support for WiFi site survey of multiple floors whose reports can be several hundred pages
- Customer-ready pass/fail assessment reports
- Floor maps details for the report
- Shows not only the collected data, but also the WiFi performance against the performance requirements
- WiFi performance requirements entered by users
- Filters entered by users for displaying information, detail levels and criteria for APs to be included in the report
- Paths of WiFi site survey
- Overall assessment of WiFi performance based on WiFi site survey results
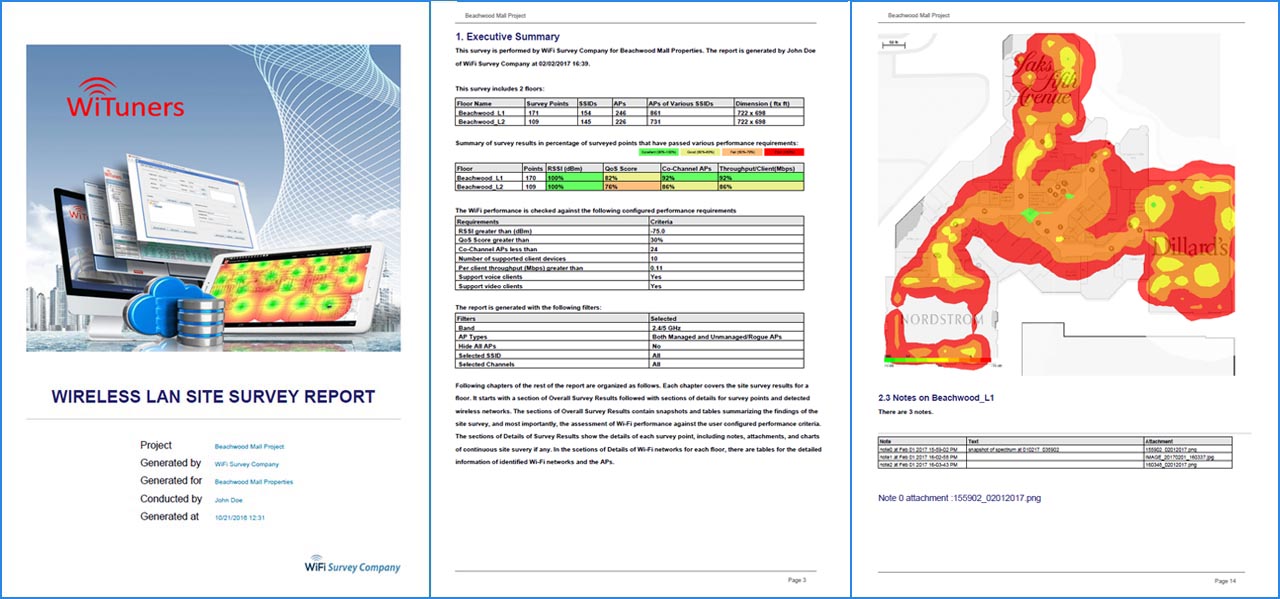
figure 28: the part of pages in a PDF report
To save the survey to a report, tap the "Generate" button, the report will be saved to the directory "../wituners/data/pdf".the report could be generated to a CVS file or a PDF file. Once a report is successfully generated, users have the option to view it immediately.
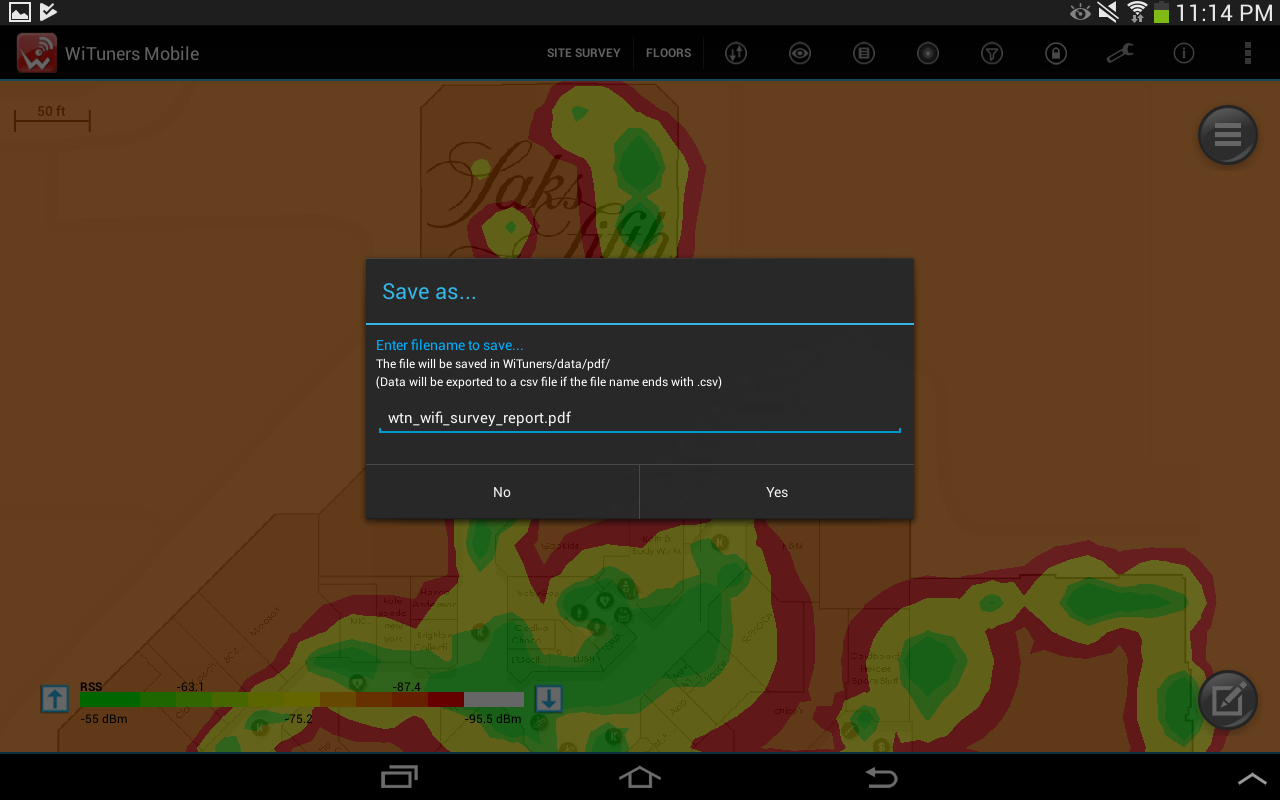
figure 28-1: Generate a PDF report

figure 28-1: Generate a CSV report
- Send a report through Emails
You need to configure the Email Ids to which the report would be sent.
In the first run of the App, the email ids have to be configured. This can be done by tapping the ![]() " Reference Icon" item on the action bar. This will display a sub menu and tap the sub menu option "Send Report". It will open a dialog; now enter the email ids one by one to which the report could be sent. Each box must contain only one valid email id. You can enter all the 3 ids or any 1 or 2, whichever is required. Enter the ids required and leave the remaining edit boxes blank. Tap Submit button. These email ids will be stored for ever and will be used while sending the Email Report. If you want to change the ids, you can edit these configured email ids later on also, by following the same procedure, now if you select "SEND REPORT" in the "Options Menu" on the very right of the action bar, the next screen will be opened with title "WiFi Surveyor Send Mail".
" Reference Icon" item on the action bar. This will display a sub menu and tap the sub menu option "Send Report". It will open a dialog; now enter the email ids one by one to which the report could be sent. Each box must contain only one valid email id. You can enter all the 3 ids or any 1 or 2, whichever is required. Enter the ids required and leave the remaining edit boxes blank. Tap Submit button. These email ids will be stored for ever and will be used while sending the Email Report. If you want to change the ids, you can edit these configured email ids later on also, by following the same procedure, now if you select "SEND REPORT" in the "Options Menu" on the very right of the action bar, the next screen will be opened with title "WiFi Surveyor Send Mail".
Fill the required details and if you want to add the AP scan information (which was displayed on the deployment floor on previous main screen), check the option "Include AP Scan Information" and tap "Submit" button. On clicking, it will open an option dialog to select the Email client. The email client has to be configured already. The options could be default mail client or Gmail client or some other. Select the client, the email client app screen will be opened and you could see enough details on the screen like
"From Address" (selected email client's email id)
"To Address" (Pre-configured email ids)
"Subject"(Phrase formed with date and time stamp)"Message Body" (Issue Description with AP Scan information)
Now tap the send button and the mail will be sent immediately and the screen "WiFi Surveyor Send Mail" will be shown. You can exit from this screen by clicking the back button once, on the device.
Passive Site Surveying
The deployment site area can be surveyed for detected access points and the survey reports can be generated for further analysis. The site survey can be started on clicking the "SURVEY" menu option on the action bar. If no access points are detected and placed on the floor map, then it is not possible to start the survey.
The Start Survey option is a toggle type option with "Stop Survey" as its toggle state. On clicking the "Start Survey", a survey robot device will be placed on the floor map. To proceed with the survey process, double tap on the floor map location where to mark the first survey point. The robot will be moved to the double tapped location and a green color circle will be displayed on the top left corner of the robot. The survey point is numbered for convenience. Like this double tap on another location on the floor map to mark second survey point. The robot will be move to second survey point. The two survey points are connected by red color dotted lines to show the survey path as Figure 28.
figure 29: the survey path on the site survey project
Like this 'n' number of survey points can be marked on the deployment floor. If there are 'n' number of survey points, the survey robot will be there on the nth survey point. The nth survey point can be deleted and the robot can be placed on the (n-1)th survey point. This can be done by long clicking the nth survey point. Thus the latest survey point gets deleted and the robot will be moved to the immediate previous survey point.
The survey point data can be obtained on tapping the survey point circle. The details will be displayed on a pop up dialog as shown in Figure 30.
figure 30: survey point data details on tapping a survey point circle
The survey data contains floor map survey location and list of Access Points within the range of the survey point as shown in Figure 30. The surveying can be stopped by clicking the toggle state "Stop Survey". This will stop the survey process. If there's any unsaved survey data present on the deployment floor, then the user will be prompted to save that data, then the survey data and survey device will be removed from the deployment floor.
Outdoor Site Surveying
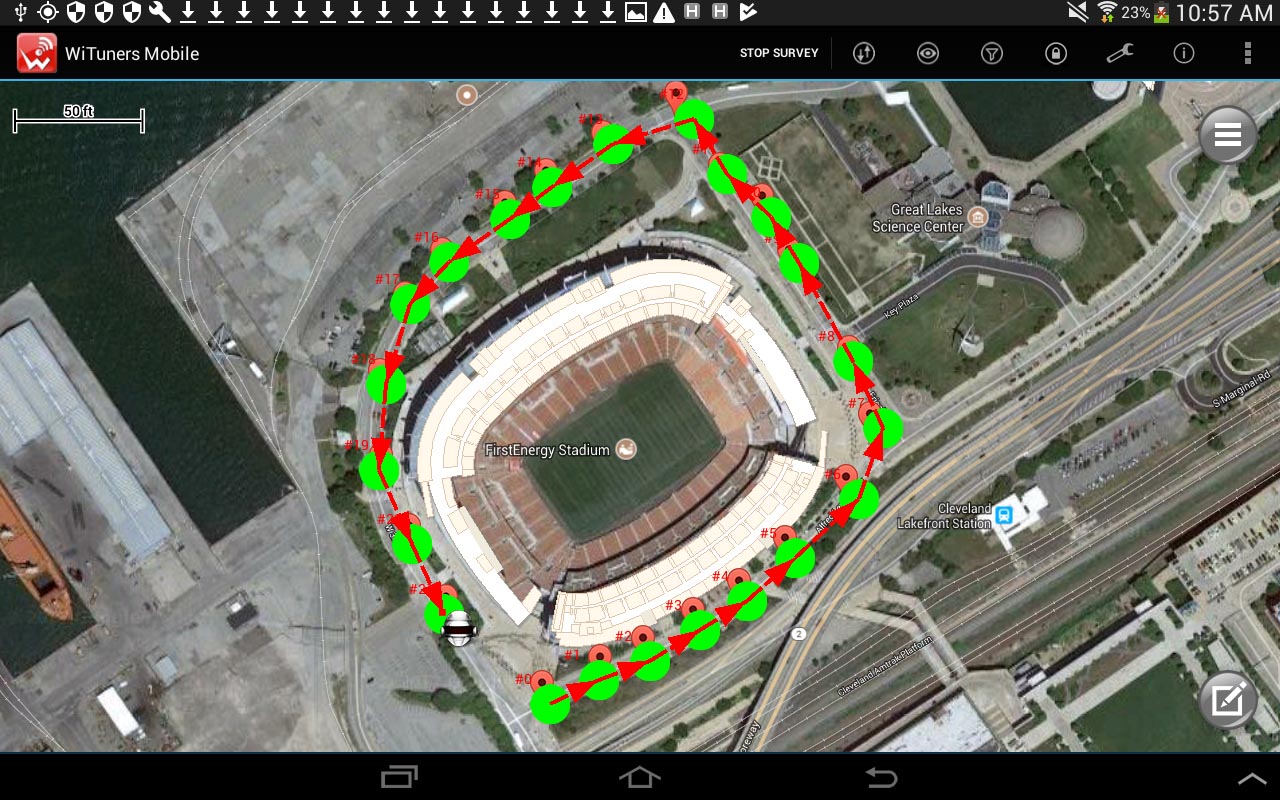
figure 31: Outdoor site survey
Make sure your tablet is built in GPS feature before performing an outdoor site survey, no extra softwares, Apps, and device needed.
- Perform an outdoor site survey
Make sure your tablet is connected to Internet, then click on "Site Survey" item on the Top Action Bar, the Site Survey Configuration dialog will be displayed as below, then click "Outdoor" in Choose Survey Environment, then Google Map will be started loading into the deployment panel. Once the GPS signal is fixed to your location, the map centered in your current location will be displayed in your tablet screen, it could take a couple of minutes to load the map depending on GPS signal strength in your area, then click "Start" button in Figure 31 to start your outdoor site survey, you can tap on the screen to move and zoom map, and double click on the map to add a survey point to an location.
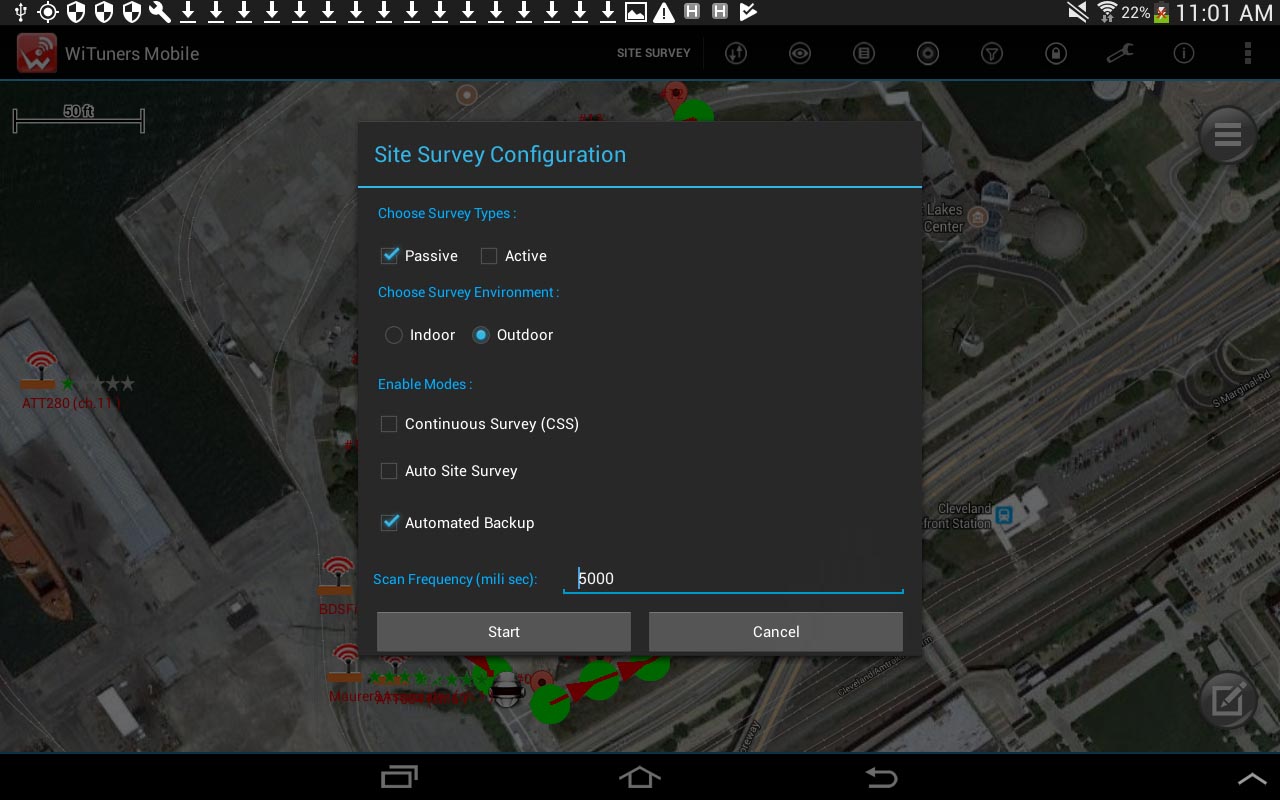
figure 32: Start an outdoor site survey
- Stop an outdoor site survey
The surveying can be stopped by tapping the toggle state "Stop Survey" on the the Top Action Bar, the site survey will be stopped, and the map could be moved and zoomed to cover all outdoor survey points you added to the map, and APs associated with the survey points also will be displayed.
- Perform a continuous outdoor site survey
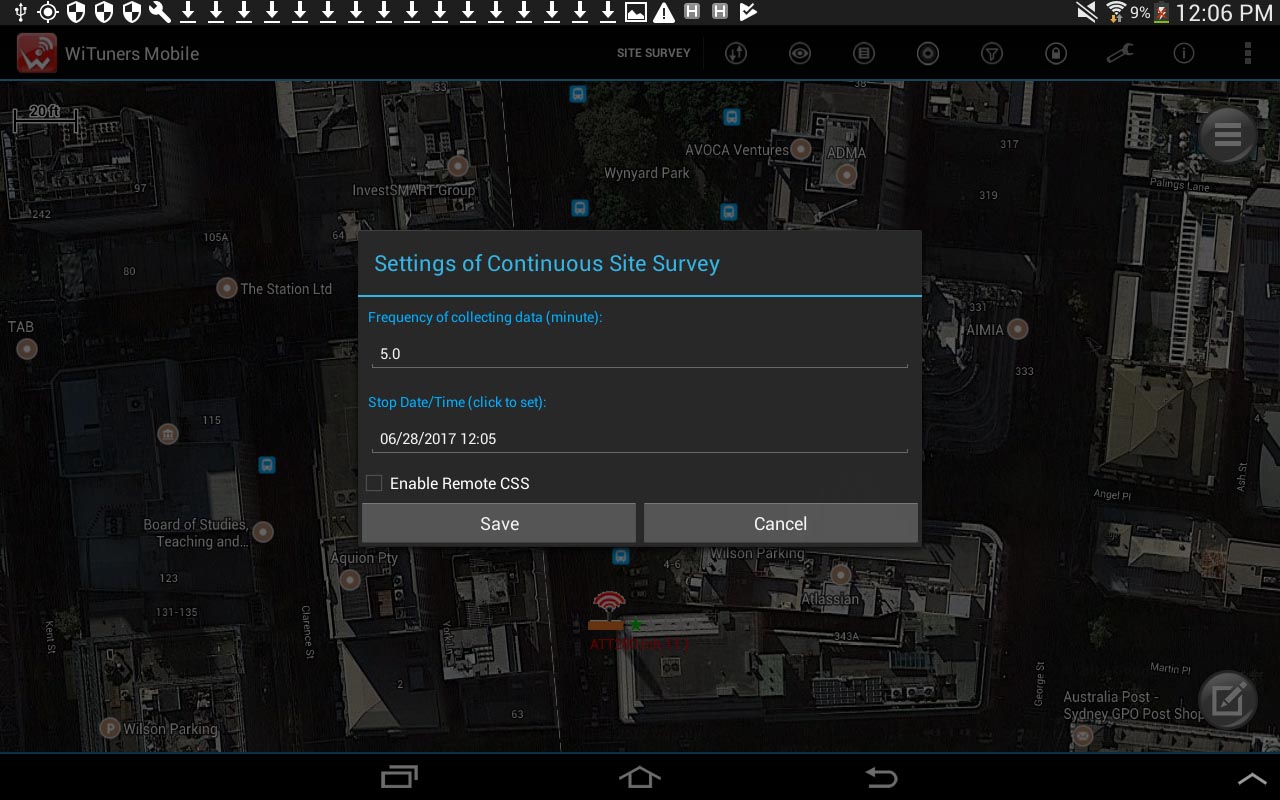
figure 33: Start a continuous outdoor site survey
- Stop a continuous outdoor site survey
The continuous outdoor surveying can be stopped by tapping the toggle state "Stop Survey" on the the Top Action Bar, the site survey will be stopped, and the map could be moved and zoomed to cover all outdoor survey points you added to the map, and APs associated with the survey points also will be displayed.
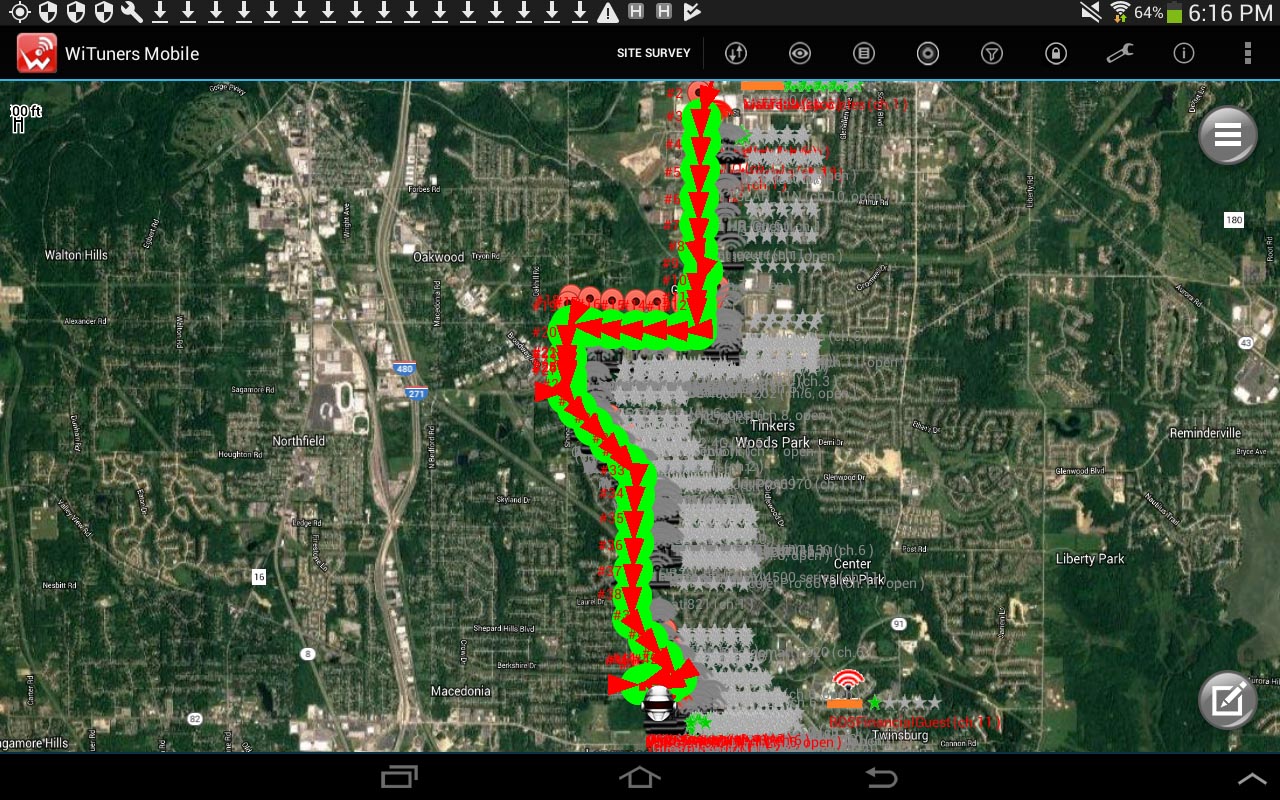
figure 34: Stop a continuous outdoor site survey
- Generate a PDF site survey report for your outdoor survey
- Save your outdoor survey data to CSV file
If you stop your outdoor survey when you tap on "Stop Survey" in the Top Action Bar, the dialog will be shown up to remind you to save your survey results, tap "Yes" button on the dialog to save your survey data to a CSV file, please see Save and Retrieve Survey Data for details. the map covered your survey area will be snapshot to an image file to save to the CSV file, you can retrieve it without GPS supported
- Perform an outdoor survey without Internet connection
If there is no Internet connection avaiable in the outside field, you still can perform an outdoor site survey with caching offline Google Map in WiTuners Mobile. First, you need to find a place where an Internet connection is avaialble for your tablet, then tap "Site Survey" on Top ActionBar, then select "Outdoor" in the Site Survey Configuration Dialog, then the Google Map will be shown up on your tablet, then tap on the map, move and zoom the map to the area where you want to perform the outdoor survey, then continue to move and zoom the map to cover all field for the outdoor survey, then don't close WiTuners Mobile on the tablet, bring the tablet to the field, you will be able to perform the outdoor survey without Internet connection at the field
Active Site Surveying
For active survey, you can perform a survey either by PING, by iPerf or by FTP. These capabilities allow you to measure the actual data upload and download throughput, jitter, packet lost from a user's perspective, ensuring that the network truly works and delivers the required performance. To be able to perform a active survey by iPerf, you need to select an iPerf server. We have built in a few public iPerf servers and you can enter the url of IP address of your own iPerf servers as well. For a active survey by FTP, we have built a FTP server by default, and you can use your own FTP server allow both writing and reading to upload and download a file.
- Active Survey by iPerf
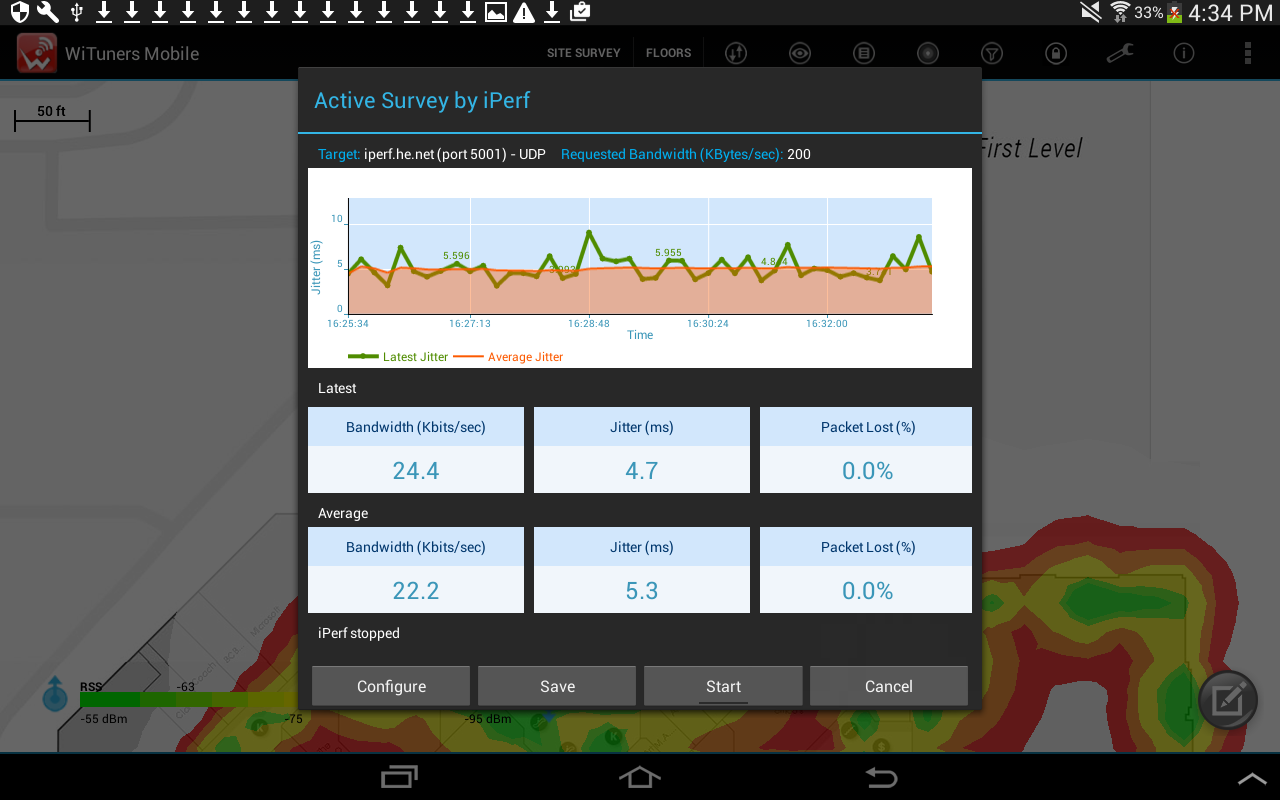
figure 35: User Interface for Active Survey by iPerf
From here, you can click "Start" button to start an active survey. You can change the configurations by click if you like. You can save the active survey results to a PDF report on your tablet, and email out the report.- Configure the iPerf
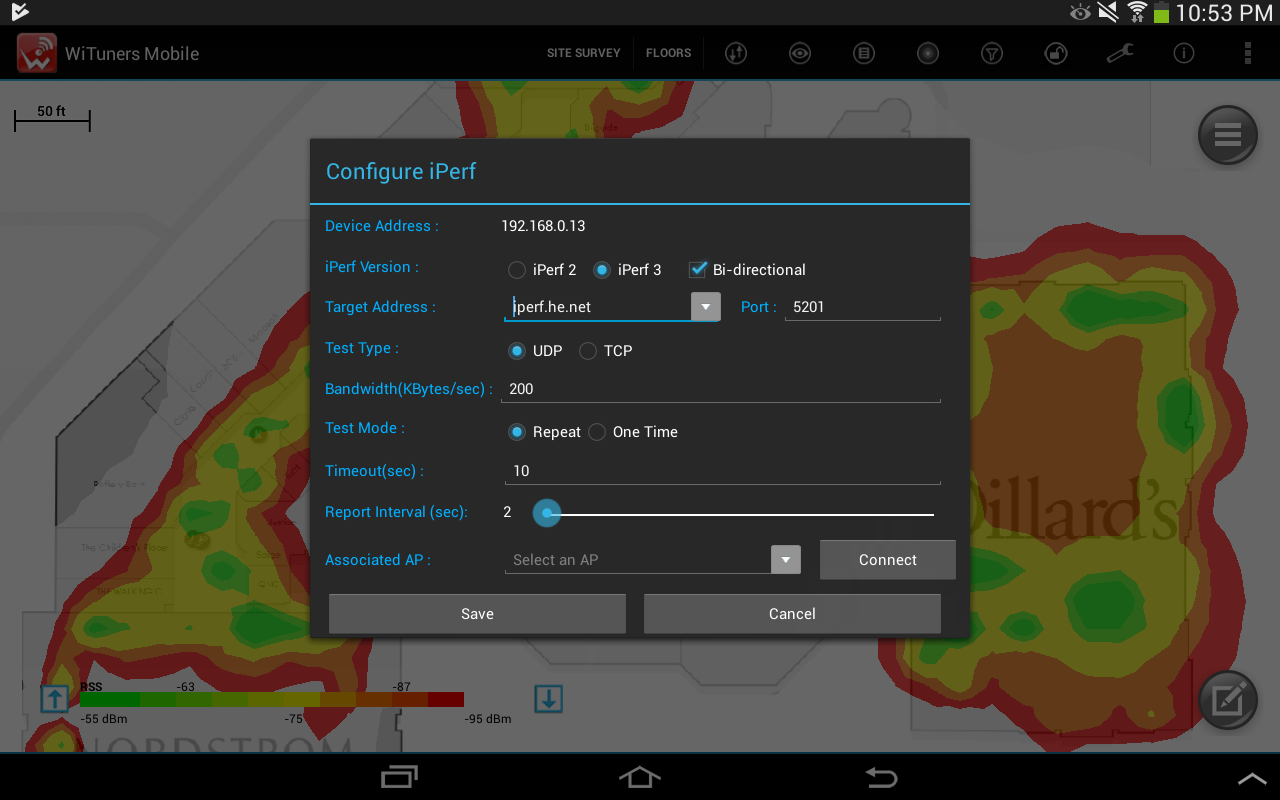
figure 36: The dialog to configure the iPerf
Go to top menu bar-->clickiPerf Version: We support both of iPerf2 and iPerf3 versions. If you check the iPerf3 version, the "Bi-directional" will be available to be set on. If it is checked, the test will be set with "-R" option on for Reverse Mode of iPerf3 to perform a downlink test, then perform a uplink test with no "-R" option on, bi-directional test results will be displayed in the chart and table
Target Address: Select or enter IP address or web site name of iPerf server
Port: Port number of the iPerf server
Test Type: Protocol UDP or TCP
Window Size (KBytes): The TCP Window Size corresponds to the "-w" command line option in iPerf which will be displayed only when the active survey type is set to "TCP"
Bandwidth (KBytes/sec): The UDP bandwidth corresponds to the "-b" command line option, which will show only when the test type is set to "UDP"
Test Mode: Select "repeat" to perform an active survey continuously until you click "stop" button. Select "One time" will run the test only once.
Report Interval (sec): The time in seconds for how long each an active survey runs - which corresponds to the "-t" command line option, for a better results.
Associated AP: Select an AP for your device to associate with from a list of APs detected by your device during an active survey.
Once you are done with the configuration, click "Save" button, then it will bring you back to The User Interface for Active Survey by iPerf.
- Start a iPerf survey
- Save results to a PDF
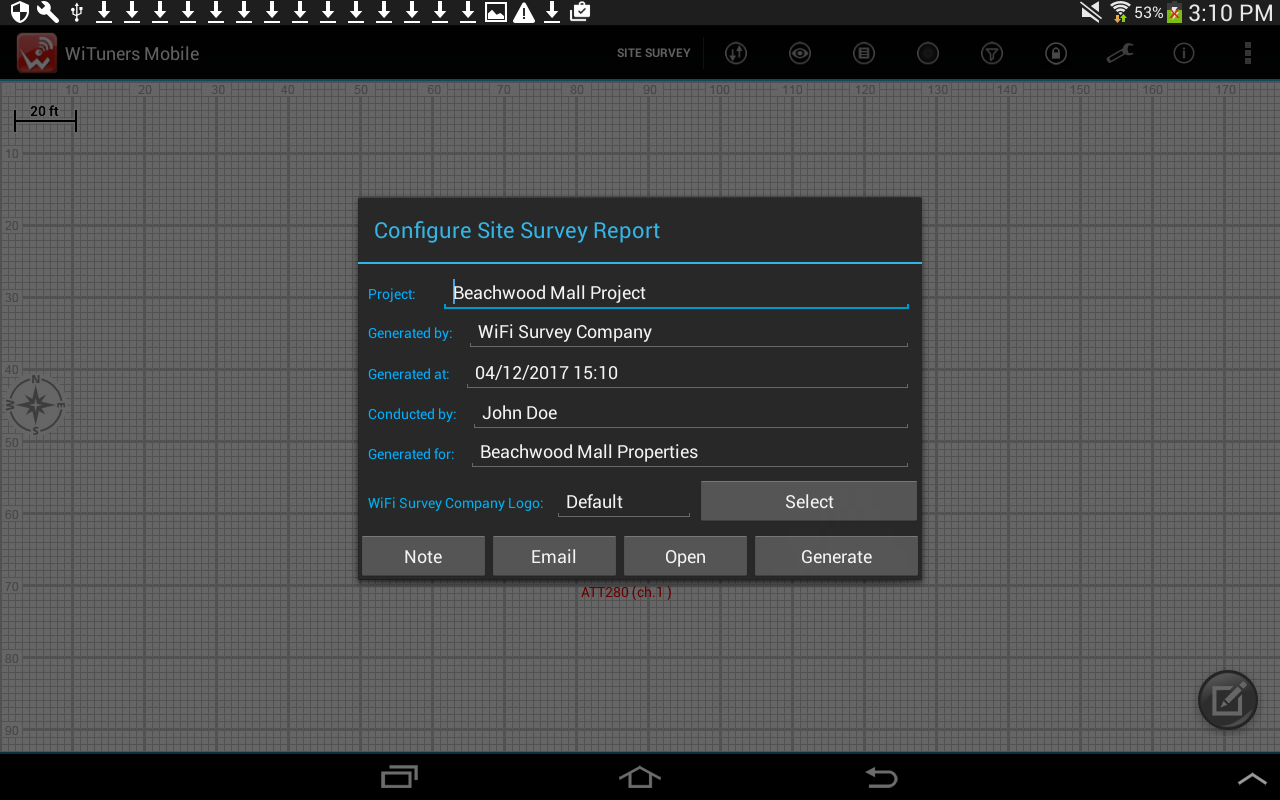
figure 37: The dialog to configure the resulting report for the active survey by iPerf
You can customize the PDF report by, for example, adding notes and your company logo to your report. Then click "Generate" button, a report will be saved to your tablet, the report could be generated to a CVS file or a PDF file.
figure 38-1: Generate a PDF report
figure 38-1: Generate a CSV report
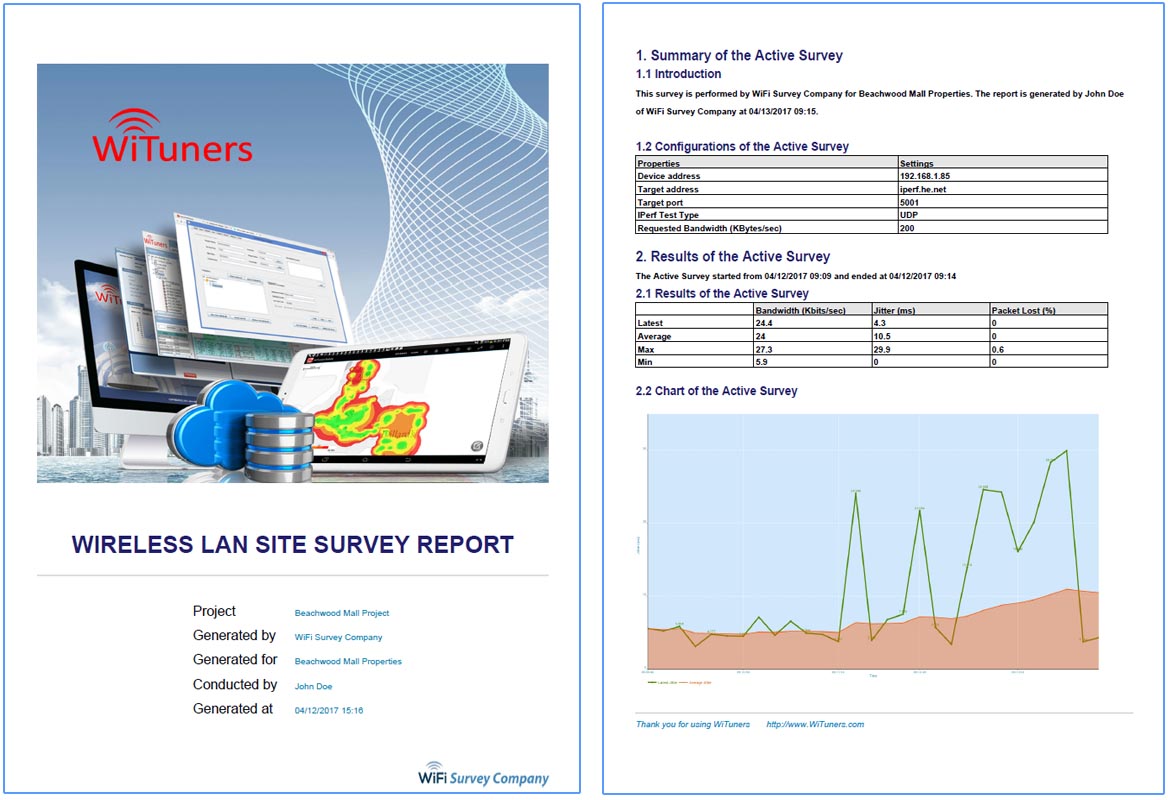
figure 38: A sample of active survey report
- Active Survey by Ping
figure 39: User interface for active survey by Ping
- Configure Ping
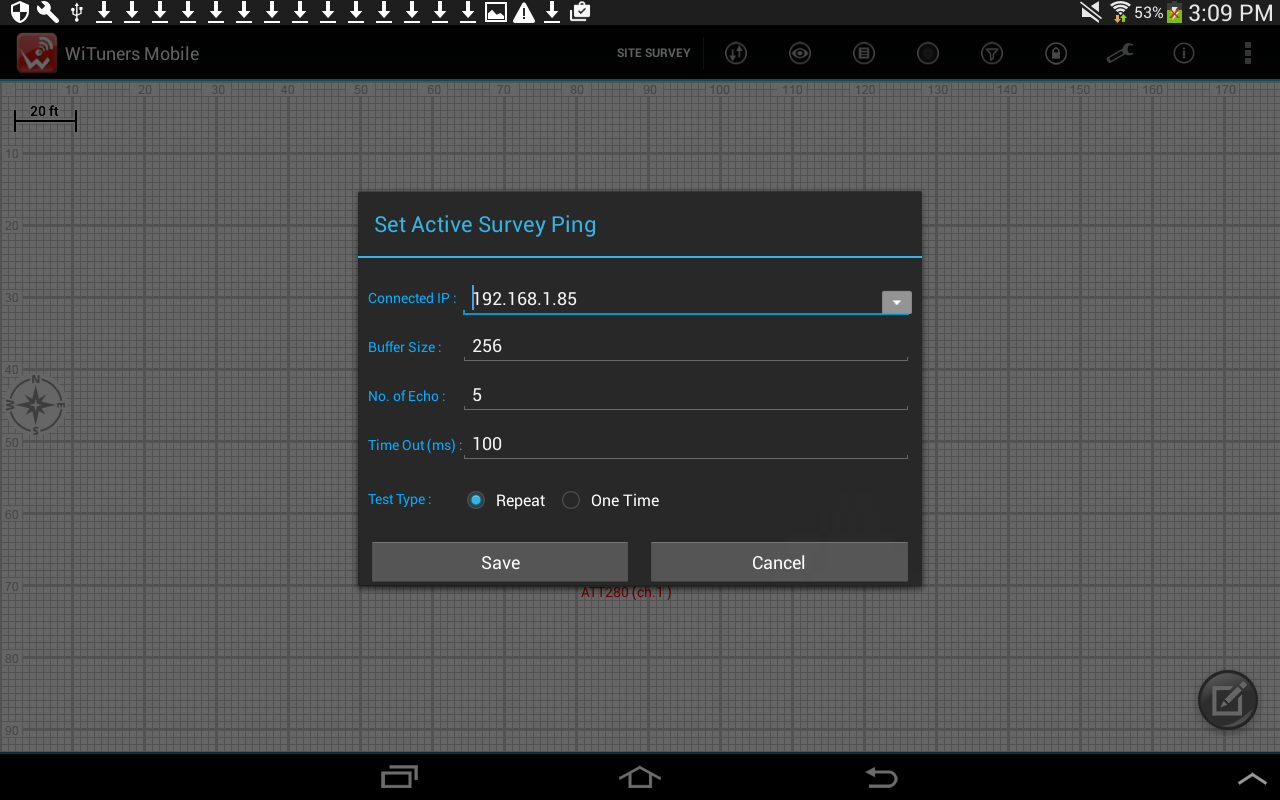
figure 40: The dialog to configure Ping
You can set the target address, buffer size, number of echo for a Ping.- Active Survey by FTP
figure 41: User interface for active survey by FTP
- Configure FTP
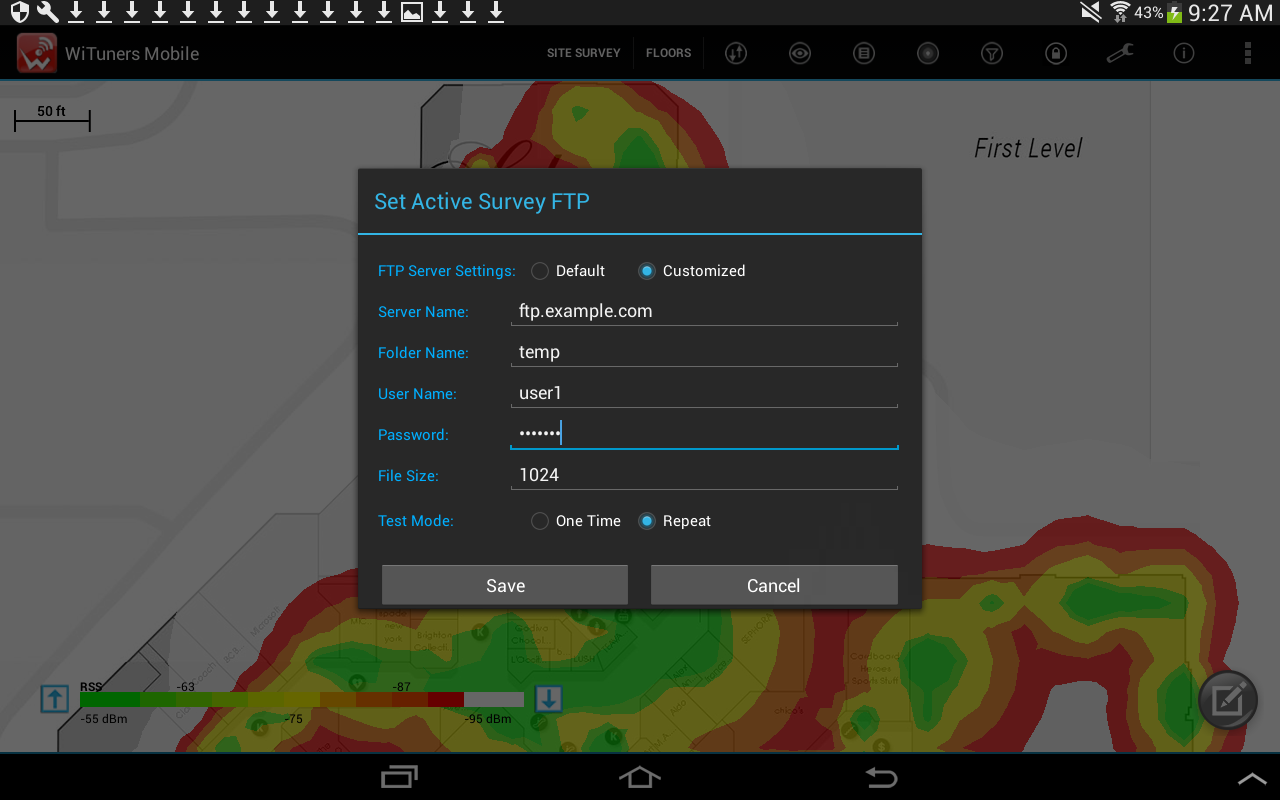
figure 42: The dialog to configure FTP
To perform an active survey by FTP, a temporary binary file in a certain size will be created in your tablet to upload and download to a FTP server. If you don't want to use a FTP server by default, click "customized" botton, the configuring options for your own FTP server will be display as figure 38, you can enter FTP server address, user name, password, a folder name for storing the temporary file, and file size (the value between 1 KBytes to 5000 KBytes is valid you can input).Saving and Retrieving the Survey Data
The user has the option to save the survey data directly at his own wish, by long tapping on the floor map to open "The System Menu", or ![]() "Views Icon" on the top action bar to get views submenu, then select the "Save to csv" option, then type in file name to save the survey data to a cvs file.
"Views Icon" on the top action bar to get views submenu, then select the "Save to csv" option, then type in file name to save the survey data to a cvs file.
The survey data will be saved to the directory "sdcard/wituners/data/csv" If the user has not saved the survey data as mentioned above, then saving the survey data will be triggered when the user exits the survey (clicking Exit Survey menu option) or Reset the deployment area (clicking Reset option on the floor options pop up menu) or Exiting the application (clicking hardware back key on the device). For all these cases, a confirmation pop up dialog will ask the user whether to save the data or not. If the user clicks Yes button on the confirmation pop up, the data will be saved, if No button is clicked the survey data won't be saved and the intended function will be performed as usual.
For retrieving data from csv, long tapping on the floor map to open "The System Menu", or ![]() "Views Icon" on the top action bar to get views submenu, then select option "Retrieve from csv". It will open a file explorer window, in which you can browse and select the correct csv file. A confirmation window for saving any current unsaved survey data will open and survey floor will be cleared to load the survey data obtained from the selected csv file.
"Views Icon" on the top action bar to get views submenu, then select option "Retrieve from csv". It will open a file explorer window, in which you can browse and select the correct csv file. A confirmation window for saving any current unsaved survey data will open and survey floor will be cleared to load the survey data obtained from the selected csv file.
The csv file will have information like number of survey points, number of access points, survey location, AP details for each survey point and floor map image file path that has been used while taking the survey. The survey retrieval will display all the survey data on the deployment floor map. If the user is interested to continue the survey with the retrieved and displayed data, he can do by just double tapping on the floor map. The further survey points are marked one by one and the robot will be moved to the last survey point.
Backup and recover WiFi site survey data
The survey data can be saved to a SQLite database running on your tablet, automatically, if the backup option set to enable in the submenu by tapping ![]() " Application Settings Icon ", it will generate a record list for your site survey data, the name for each record in the list obtains a timestamp string for time information, floor map name, and deployment name (it is one-click code if it is a Remote project from WiTuners Planner) information, so that you would be able to find which data you want to recovery
" Application Settings Icon ", it will generate a record list for your site survey data, the name for each record in the list obtains a timestamp string for time information, floor map name, and deployment name (it is one-click code if it is a Remote project from WiTuners Planner) information, so that you would be able to find which data you want to recovery
Continuous Site Surveying (CSS)
Tap ![]() "Site Survey" in the top action bar
"Site Survey" in the top action bar
figure 43: the dialog window for starting CSS
After you set to a frequency of collecting data and stop time, then tap "Start" button, CSS window will be displayed on your screen.
figure 44: CSS Chart
In CSS window, you can see two top action bar, top one comes with two tag table, you can switch the window between "CSS Chart" and CSS Table".
figure 45: CSS Table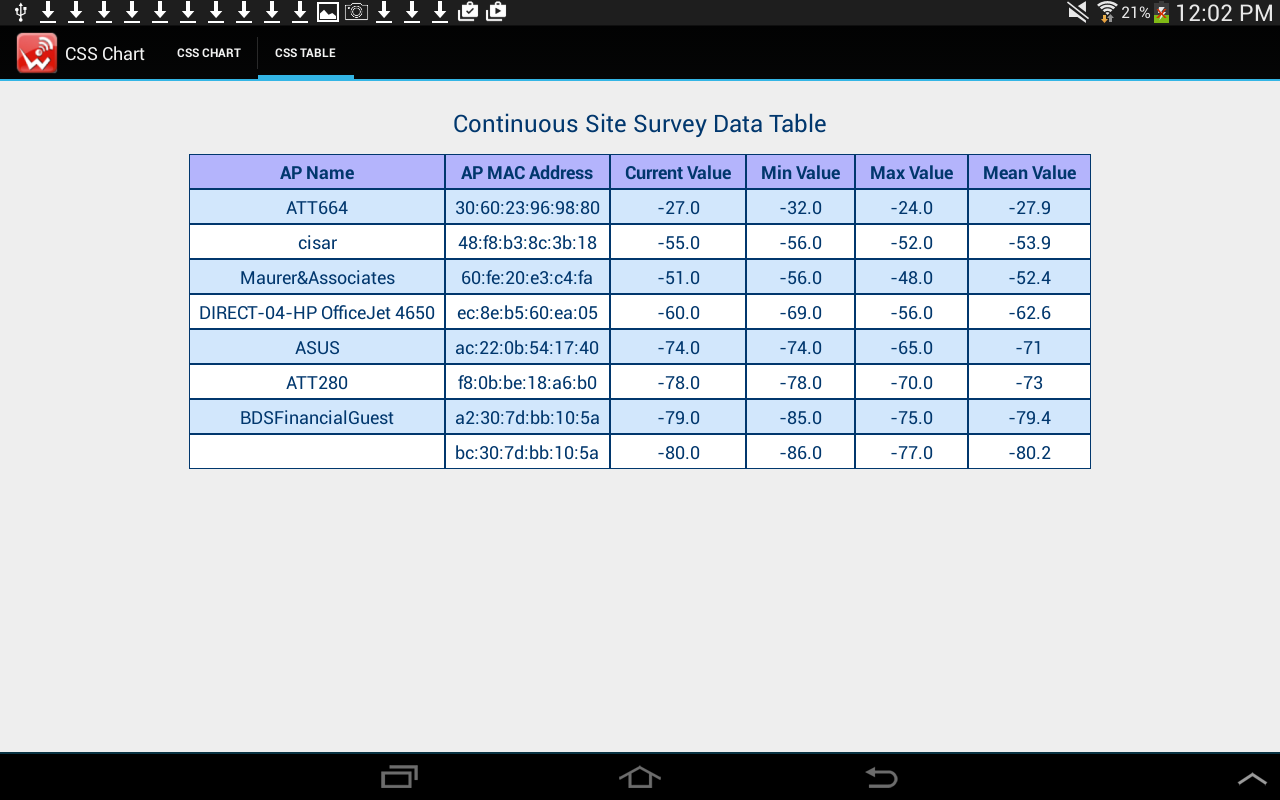
On next top action bar in CSS window, there is a check-box list you can tap on, then all of APs detected will be on the list, you can select any of them to collect the WiFi survey data continuously in a period of time you set to. There are zoom in/out icons in the top action bar, you can use it to select the best view for your CSS chart.
Remote Project
Remote Project is a feature in our another product "WiTuners Planner" integrated with this app to support for remote projects with automation. One does not have to leave his office to complete a WiFi projects for locations several thousands miles away. Multiple locations can be done at the same time. As a result, using WiTuners Remote Projects reduces both time and cost. Here is how it works:
- Use WiTuners Planner in your office to
- create a WLAN deployment plan
- load floor maps, set scales and define the survey locations.
- one-click upload the plan into the cloud
- Email the user of this app in the remote location the one-click upload code
- The user of this app
- load the plan into this app with the one-click code.
- walk about in the site and tap on the pre-defined survey location to collect survey data and take notes or pictures along the way.
- save and upload the results to the cloud with one click.
- Use our WiFi planning software in your office to
- fetch the survey results with a click.
Spectrum Analyzer
Inserting a Meta Geek Wi-Spy DBX spectrum analyzer dongle into your Android Tablet first, then tap this item to open WiTuners Spectrum Analyzer as below,
figure 46: the dialog window for spectrum configurations
Tap "Set Sweep" to set a RF band, then tap "Get Sweep" to set a start frequency, then tap "Start Sweep" to start a spectrum analysis, a new window will be display to allow you to view a WiFi Spectrum as below.
figure 47: real time spectrum analysis chart
On the top of action bar, there are two tag tables which you can tap one of them to switch WiFi Spectrum View to DBx Sweep Configuration, you can reset configuration, or you can take a screenshot on the WiFi Spectrum View and a snapshot on the specturm data for your PDF report.
Resetting the Application
The deployment floor on the application can be cleared to its initial state with white grid background. All detected and placed APs and any survey data marked on the floor will be removed. The floor map image will be replaced with white grid background. This can be done by long clicking on the floor map, it will open the The System Menu, click the "Reset the application" option. If there's any unsaved survey data present on the deployment floor, then the user will be prompted to save that data before the reset function begins.
Exiting the Application
The application can be closed by clicking the back key on the device. If there's any unsaved survey data present on the floor, it will prompt the user to save the data.