|
This tutorial illustrates WiTuners features and usages through an example. For details of the features or user interface, you can reference the corresponding topics in the manual.
WiTuners is an integrated wireless Planning, Auditing, Optimization, and Reporting application that provides an integrated suite of tools to plan, deploy, manage, and tune your WLAN system. The application is launched from the WiTuners website (http://www.wituners.com) as a SaaS (Software as a Service), but it is also available as a local application, if required.
Startup Deployment
Upon launch, a welcome screen provides a list of tasks to select from. You can select to load an example deployment to learn how to use WiTuners.
When the example is loaded, a default multi-floor hotel is displayed with access points (APs) already populated on two floors. Do not be hesitant to explore the deployment – it will be reloaded to its default configuration the next time you load it.

A brief introduction of the user interface
·The center of the example screen is the deployment panel for displaying the wireless network's planning components, such as walls, APs etc. Most manipulation of planning will be performed in this panel. The panel can be detached and placed in a separate window by clicking on the detach icon on the top right of tool-bar to maximize its view for easier operation.
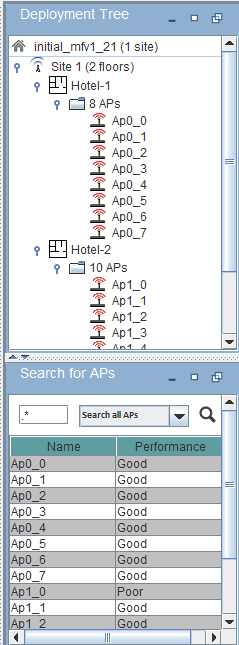
·On the left of the screen, there is a chart showing the sites access point (AP) tree. The chart is identified by site, floor and Aps by floor. Clicking on any of these features will interact with the corresponding elements in both the floor plan as well as the configuration chart on the right. The chart also contains a search function to identify Aps by a number of different criteria identified by drop down menu.The AP tree chart can be expanded or collapsed with arrows at the top of the chart.
·On the right side of the screen is a chart showing configuration information by site floor or individual AP. The panel at bottom-right is a statistics window. It shows the properties of the selected AP on the deployment panel. Like the AP Tree chart, the Configuration chart can be expanded or collapsed by dragging or with arrows at the top.
·On the top of the application, is the main tool-bar with tabs for all of WiTuners functions. On the main screen is button tool-bar providing a number of viewing options for the current deployment. There are also icons for walls, APs, etc. on the button tool-bar that can be dragged and dropped onto the deployment panel.
·On the bottom of the applet, there a button This is an Evaluation Copy which is for entering the license key upon clicked.
·
·Right-clicking on the deployment panel will show the system pop-up menu, which contains many frequently used selections. When the mouse is over an AP, a wall, a deployment area and a SSR etc., a component specific pop-up will show up, which contains menu items specific to that component.
·By hovering your mouse over a component, such as a wall or a deployment area, a tool-tip will usually show up for hints of possible operations to that component.
·At any time you want to access the user manual, it is one-click away from the Help icon  at the top of the application. at the top of the application.
Access Points (APs)
The APs can be moved about to any location on the deployment panel by clicking and dragging with the left mouse button. When an AP is highlighted, its characteristics can be seen on the AP Tree and the Configurtion and Statistics charts on the left and right sides of the screen. Alternatively, you can right click on an AP to see its characteristics as well as to delete it.

Note that some of the APs may be lightly shaded. These are Shadow APs  located on other floors but whose signals are leaked to the current floor. located on other floors but whose signals are leaked to the current floor.
If you want to add an AP, click and drag the Add AP icon  down from the button tool bar. down from the button tool bar.
You can select multiple APs by clicking APs with Ctrl-key pressed down. Then you have the capability to move, delete or set their properties as a group. This is the so-called group mode for APs.
You can select all the walls to apply the changes at once by selecting All Walls under the system pop-up.
Note that in addition to AP properties, the AP Summary dialog box is also where you set the requirements such as the number of supported clients and the required load for each client.
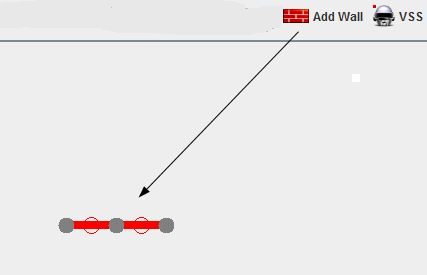
Walls
Some of the walls are highlighted in gray. By right clicking on a wall, it will be shown in bold, with end and midpoint selection dongles. Right clicking will show its characteristics and give you the opportunity to change or delete them if desired. You can move the walls by clicking and dragging with the left mouse button. Add a new wall by clicking and dragging the Add Wall icon down from the Menu Bar. Walls can be subdivided and "bent" by moving the open circle dongles.
.png)

There are a number of ways to manipulate a wall, as shown by the tool-tip when you hover your mouse over a wall. For example, with SHIFT-key pressed down, dragging at a handle will grow a new section of wall from the handle. You can also delete a section of a wall by selecting the section with ALT-KEY down and press Delete key or the Delete item on the wall specific pop-up.
In case you want to undo a wall operation, simply use CTRL-z to undo it, and CTRL-y will redo the change.
You can select multiple walls by clicking walls with Ctrl-key pressed down. Then you move, delete or set their properties as a group. This is the so-called group mode for walls.
You can select all the walls to apply the changes at once by selecting All Walls under the system pop-up.
You can copy a selected wall or a group of selected walls with CTRL-C or the Copy on the wall specific pop-up, move your mouse to a point, then make a paste with CTRL-V or the Paste Wall Here on the system pop-up.
Since placing walls on a floor plan take significant effort in making a deployment plan, make sure you are familiar with all the means to operate on walls, which can significantly reduce your time to generate a plan.
Deployment area and the wall around it
Deployment area is the area that the APs are supposed to cover. It is often the border of a building or a campus etc. whose shape can be a rectangular or irregular. When using the wizards to automatically place APs, it is important to set the deployment area properly since the APs will be automatically placed within the deployment area. In addition, heat-maps for viewing the performance of the deployment will visually display the data only within the deployment area.
There is a default deployment area provided by WiTuners. You can view the deployment area by click on the Deployment Area on the Button tool-bar  . When a floor map is loaded, the deployment area is defaulted to the rectangular border of the floor map. You can customize the deployment area by changing its location, changing its shapes etc using the the handles at the middle or ends of the edges of the deployment area in a similar way you operate a wall. . When a floor map is loaded, the deployment area is defaulted to the rectangular border of the floor map. You can customize the deployment area by changing its location, changing its shapes etc using the the handles at the middle or ends of the edges of the deployment area in a similar way you operate a wall.
When the deployment area is in place, you can add a wall around the deployment area by selecting Deployment Area Wall under the system pop-up, which will greatly reduce the amount of time to place walls over a deployment area with irregular shapes.
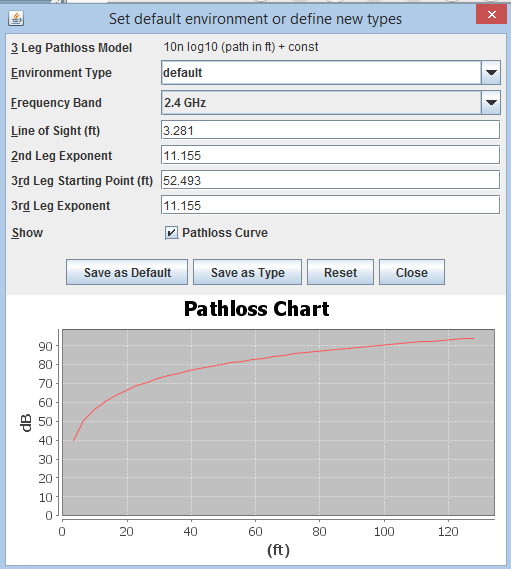
Environment
Environment here represents the radio signal propagation characteristics where the wireless networks to be deployed. It can be indoor or out door. It can be a campus or a warehouse. Each has its own characteristics. Environment types are set with the 3-leg path loss model. WiTuners has a set of predefined environments. Users can also define and save their own environment types.
You can set or select an environment type for the current floor from the system pop-up. On clicking the Path loss Curve, you can see the path loss diagram for the model you selected, a convenient means to help you define the environment for your needs.
Set defaults
Default types of APs etc are frequently used when you plan a deployment with WiTuners. For example, when you drag the wall icon from the top tool-bar onto the deployment panel, a new wall is added whose properties use what is defined by the default wall type. From the Settings on the top tool-bar, you can select to set the default types for default AP, default Client, default wall type, and default environment.
3-D Multiple floors
Several floors can be included via the AP Deployment tree structure at the right of the window. Each floor (two floors in the default example deployment) is shown as a separate branch of the tree. Its height and offset relative to the other floors are listed (in meters or feet). All of the APs assigned to a floor are listed as branches on the floor tree. Their characteristics are also shown in the configuration chart on the right as they are highlighted. By right clicking the site and/or floors on the AP Tree, floors can be added, duplicated or deleted.
Save and load deployment
If you'd like to save your deployment changes, click on the Save Deployment button under the Planning tab and you will be presented with a file solicitation box. The deployment can be later retrieved by clicking on the Load Deployment button.
.jpg)
Check performance of a deployment
To ensure a deployment is really optimal and meets the customer's requirements, WiTuners enables its users to check the performance of the current deployment from various perspectives, which include heatmaps, coverage hole detection, AP summary, virtual site survey etc.
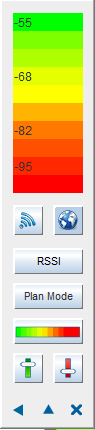
The button tool-bar at the top of planning screen allows you to see RSSI values, Radiation Circles, Deployment Areas, Heatmap, Zoom control, Grids, and other Settings. All of these can be changed in any order. Additional APs can be dragged down from the Add AP icon in order to fill in areas of low coverage or locations where traffic is expected to be particularly dense.

Heatmaps
A heatmap visually shows the distribution of a metric over locations within the deployment area on a floor plan. The metrics to be observed in the heat maps include RSSI ( the receiver signal strength indicator), the signal strength, the data rates, the throughput, the QoS Score etc, which can be selected from the drop-down list in the heat map indicator. The heat map indicator contains a drop down menu to allow the heatmaps to be viewed by different variables. The heat map indicator can be shown or hidden by checking the Heatmap button  on the top tool-bar. on the top tool-bar.
The metric observed can be a single selected AP, or all the APs on the floor. Note that the metric's reading varies depending whether it is observed from the AP's perspective or the client perspective. So you can select to view by AP or by client.
Note that any changes in the AP properties, client properties, their locations, properties of walls and their locations etc will be reflected immediately by the heatmaps.
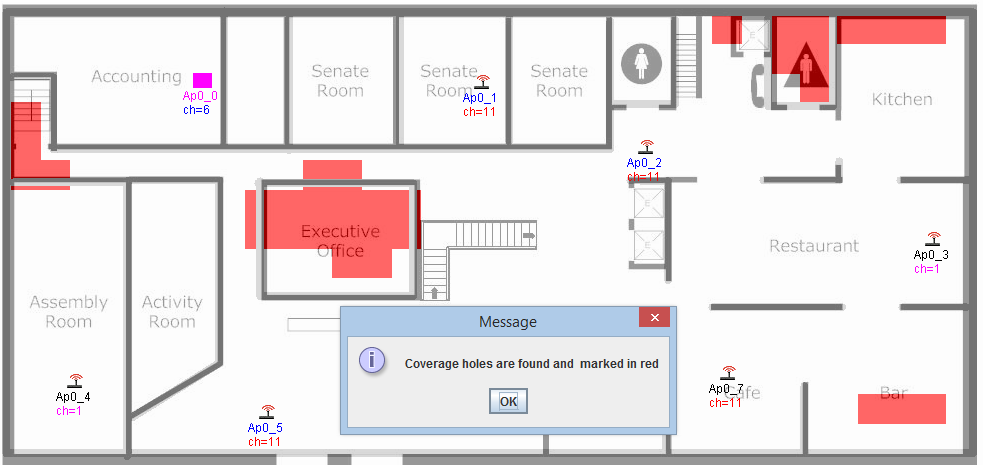
Coverage hole detection
Coverage holes are the area on the floor map within the deployment area that the communications between a client and APs can not be covered at a required minimal data rate of the client. The minimal required data rate of a client is set through the properties of the SSR or the default client properties. Due to the asymmetries between the links from an AP to the client or the client to the AP, the coverage holes varies with the views by AP or by client which can be selected with the heatmap indicator. To detect a coverage hole, check on Coverage Hole  on the button tool-bar or select it from the system menu. You can notice that the coverage holes change with the default client properties, AP properties, their locations, properties of walls and their locations. on the button tool-bar or select it from the system menu. You can notice that the coverage holes change with the default client properties, AP properties, their locations, properties of walls and their locations.
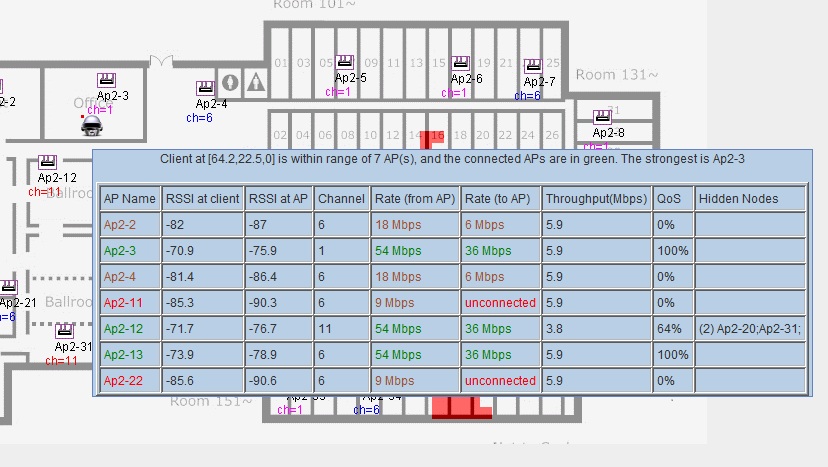
Site Survey Robot
Drag the SSR icon  on the button tool-bar onto any location within the deployment area on the floor plan. When the mouse hovers on the robot, a tool-tip will pop-up displaying the information that the client represented by the robot will observe at that location. The information is very comprehensive, even includes hidden nodes and their effects at that location. on the button tool-bar onto any location within the deployment area on the floor plan. When the mouse hovers on the robot, a tool-tip will pop-up displaying the information that the client represented by the robot will observe at that location. The information is very comprehensive, even includes hidden nodes and their effects at that location.
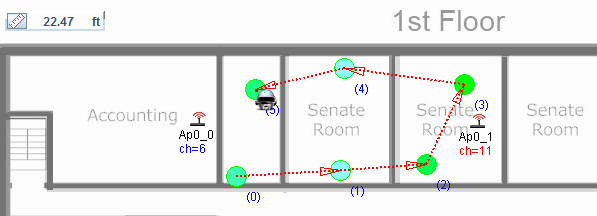
Right-click on the SSR when it is on the deployment panel, a SSR specific menu will pop-up. From there, you can set the properties of the Client that SSR represents. You can also start a virtual site survey from there by selecting Survey. Once you select Survey, the SSR goes into survey mode. Move the SSR around and click at the survey points, the locations you are interested in. The survey points will be shown with circles connected by traces. Hovering your mouse over such survey points will show tool-tips for the survey data at that location. These survey data can be saved and retrieved later from the SSR specific pop-up menu.
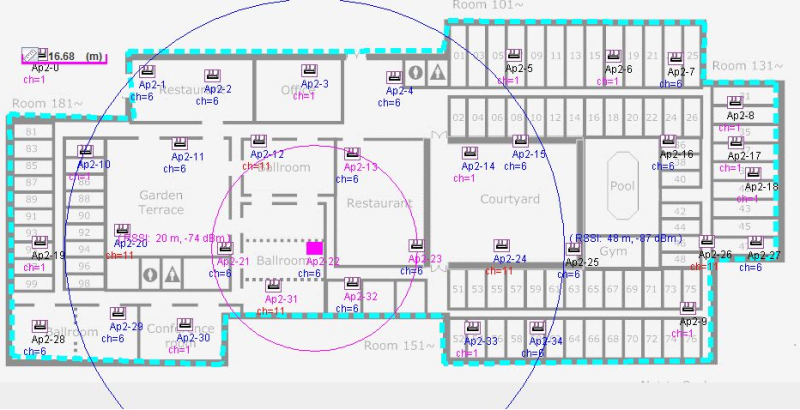
RSSI and Circles
Check on Circle on the button tool-bar  will display two circles around a selected AP. The inner circle represents the range of the AP at its minimal data rate and the outer circle represents the range of its sensitivity. Note that this range is approximate in that it does not count the impacts of walls within the circles. will display two circles around a selected AP. The inner circle represents the range of the AP at its minimal data rate and the outer circle represents the range of its sensitivity. Note that this range is approximate in that it does not count the impacts of walls within the circles.
Check on the RSSI on the button tool-bar  will display the RSSI numbers relating to the selected AP at each AP who can hear from the selected AP. These RSSI takes into account the walls between each AP and the selected AP. will display the RSSI numbers relating to the selected AP at each AP who can hear from the selected AP. These RSSI takes into account the walls between each AP and the selected AP.
Automating the deployment planning
|