|
Show heat map with two modes from Site Survey and Audit
WiTuners All-in-One Wi-Fi Solution uniquely gives a complete view of Wi-FI coverage by integrating downlink site survey data from Live Site Survey in WiTuners Planer or WiTuners Mobile and the uplink site survey data from continuous audit data by WiTuners Connected at the same time.
There are two modes of heat-maps: the Plan Mode which uses virtual site survey created in a deployment plan with the virtual client, and the Live Mode which uses the live site survey data and the audit data from WiTuners Connected.
View heat-map in Live Mode with a site survey and an audit on a WLAN at the same time
Step 1 Open a Deployment Plan
If you don’t have a one-click code for the deployment, Go to Top Menu, click Cloud - > One-Click-Code Upload, to upload the deployment plan.
Step 2 Start Continuous Audit
Click WiTuners Connected --> Start Continuous Audit, then set the configuration for the audit, make sure Recording checkbox is checked, and select Merge option for Loading Mode. Merge APs from your WLAN controller to the current deployment plan after connected to WLAN, then start the continuous audit.
Step 3 Perform Site Survey by WiTuners Mobile in the Field
Click Remote Project in the system menu on WiTuners Mobile, type in the one-click-code to load the deployment plan to WiTuners Mobile. Then perform site survey on the deployment plan, make sure the survey points added to map should be exact locations you walk on the field.
For accurate data collection, we recommend the time interval between survey-points be more than the time set on the audit for Refresh Duration. The survey point locations should cover APs as much as possible, we recommend add 3 to 4 survey points around each AP with different distances.
Step 4 View the Uplink and Downlink Heat map
After you are done with the above steps, you have both the downlink site survey data, and uplink the site survey data by audit data for the WLAN. View heat-maps in Live Mode by:
Click Cloud -> One-Click-Code Download, load the deployment by the code.
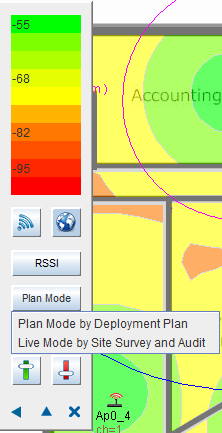
Then go to Heat Map Indicator, click Live Mode
Select uplink view
Click on the icon  in the Heat map Indicator to view uplink heapmap. in the Heat map Indicator to view uplink heapmap.

Select downlink view
Click on the icon  in the Heat map Indicator to view uplink heapmap. in the Heat map Indicator to view uplink heapmap.

|