|
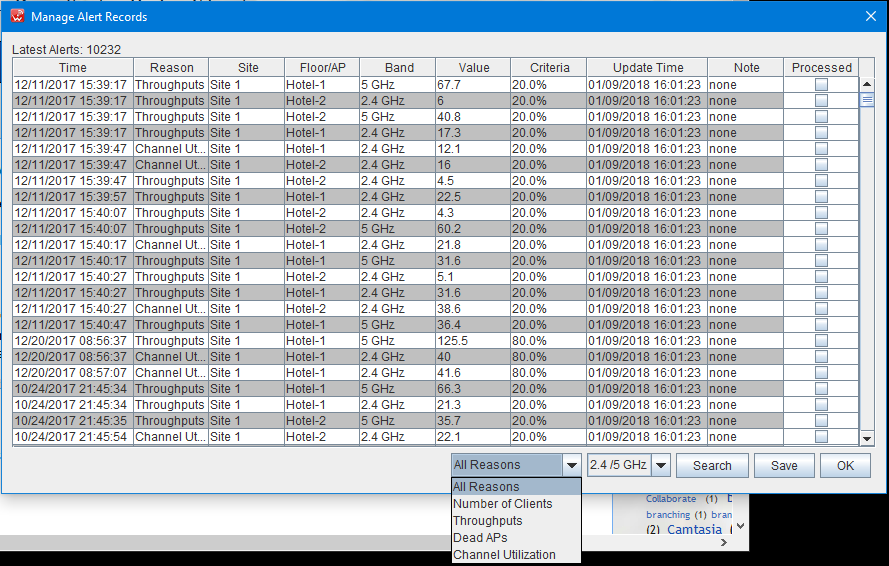
Manage Alerted Issues
When you click the Start Auditing button, the auditing screen at the bottom of the Main Window of WiTuners will depict a capacity versus time plot. There will be three lines.
The first one will be maximum capacity in purple.
The second one will be a red alert line.
The third one will be a green block which is the current simulated throughput of the network.
At the bottom of the Traffic Load Graph, there is a drop down menu from which you can choose to depict traffic load, call capacity or a number of other monitoring functions. You can also determine whether you wish to show traffic for all the APs or just selected numbers of the APs. The Start Auditing button that you originally clicked has changed to Stop Auditing and when you click it, the auditing stops. You can pause the recording with the Pause button at the bottom, you can clear the recording, or you can take a static snapshot of the recording and put it in whatever file location you wish.
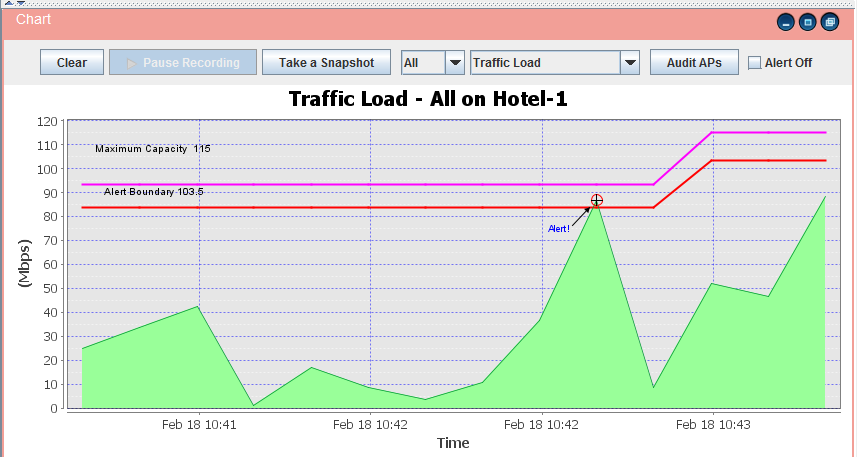
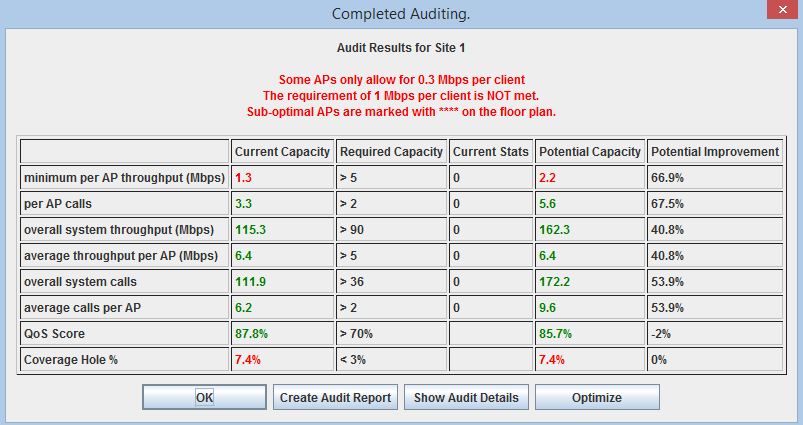
If the alert line is crossed by the simulated capacity line, a small alert warning will be shown by an x on the red line. This indicates that you are running into danger of reaching the maximum capacity of the network. A pop up box will give you the opportunity to audit the network and view performance changes that would result from optimization. If you choose yes, you will get a notice of the new throughput and call capacity as shown above.
|