|
Audit Chart
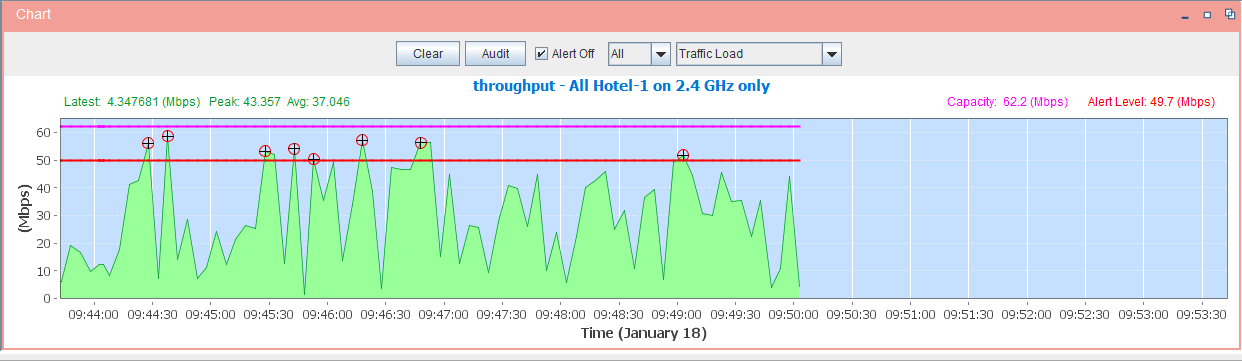
When you click the Start Auditing button, the Auditing Chart at the bottom of the Main Window of WiTuners will depict a capacity versus time plot.
There will be three lines.
The first one will be maximum capacity in purple.
The second one will be a red alert line.
The third one will be a green block which is the current simulated throughput of the network.
At the bottom of the Traffic Load Graph, there is a drop down menu from which you can choose to depict traffic load, call capacity or a number of other monitoring functions.
On the top of Audit Chart, there is a Audit Control Bar, users can use the buttons and other control items to show the real time WLAN performance of individual APs or the overall wireless networks in both charts and tables in various metrics, such throughput, noise level, signal noise ratio, received signal strength, number of clients and channel utilization.

On the top of Audit Chart, there is a Audit Control Bar, users can use the buttons and other control items to show the real time WLAN performance of individual APs or the overall wireless networks in both charts and tables in various metrics, such throughput, noise level, signal noise ratio, received signal strength, number of clients and channel utilization.
WLAN Performance in Various Metrics
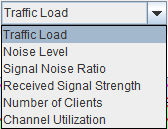
Click on "Traffic Load", there are throughput, noise level, signal noise ratio, received signal strength, number of clients and channel utilization in the drop down menu, if you select one in the drop down menu, the audit chart will be switch to the real time chart for the metric.
WLAN Performance for Individual APs
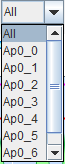
Audit Chart is not just shown real time WLAN performance for whole floors, also you can select an access point in the floor to show the Audit Chart for the AP.
Click on the "ALL" button, to show the AP list for the floor in the drop down menu, you can select an AP in the list to show the WLAN performance chart for the AP you select.
|