|
All Site View
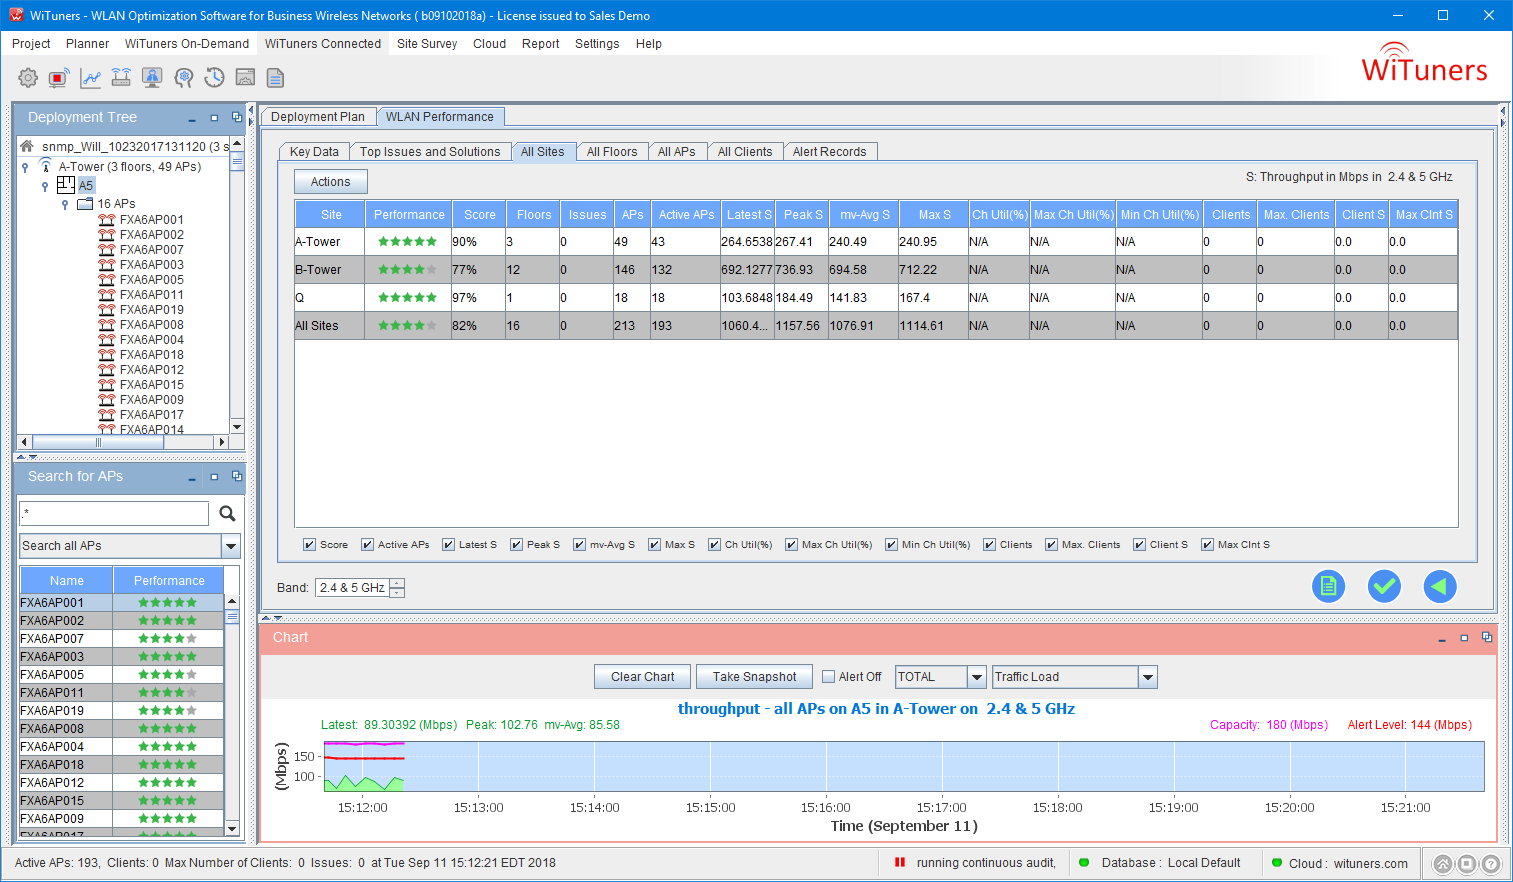
All Sites Table shows the performance data of each site. You can sort the sites by various columns of performance stats. The Action button at up-left corner of the table enables user to view more details of a selected site.
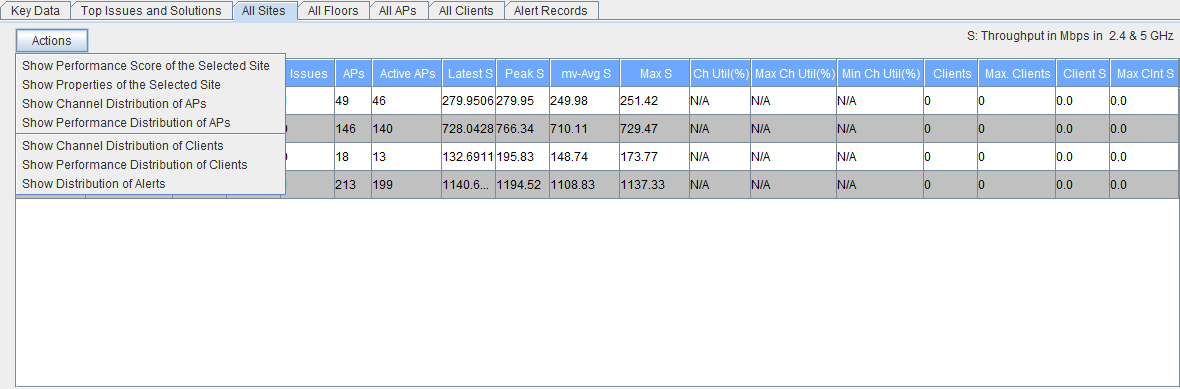
Show Performance Score of the Selected Site
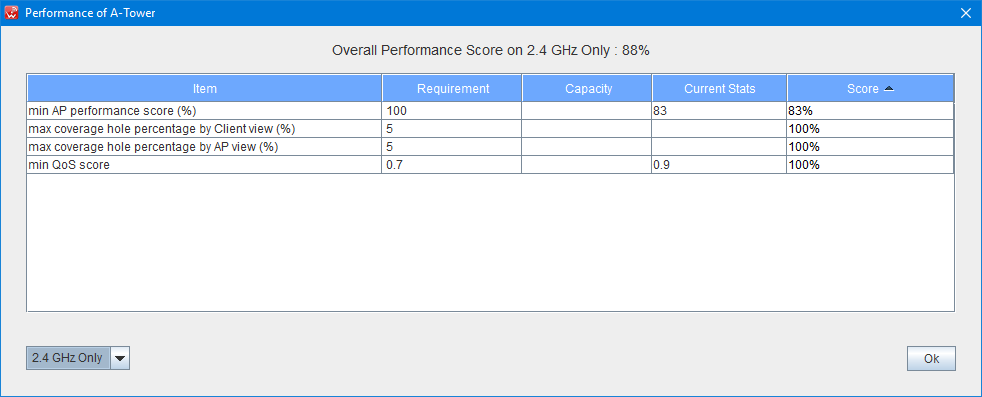
The table above, for example, shows overall and itemized performance scores on 2.4 GHz Only of the selected site A-Tower
Show Properties of Selected Site
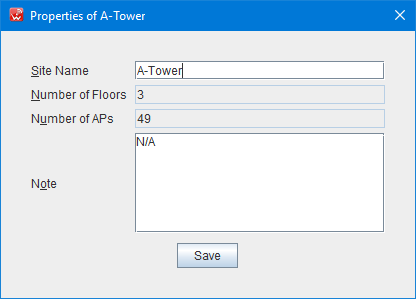
You can view and edit properties of a selected site as the above.
Show Channel Distribution of Aps
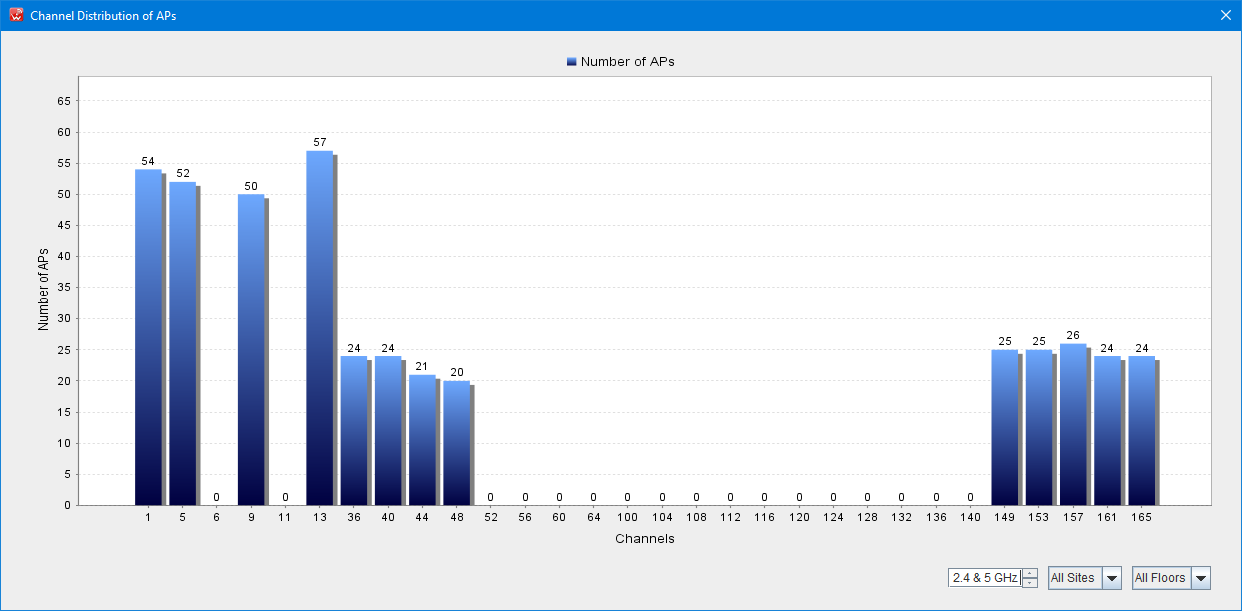
The bar chart shows the distribution of the number APs in each 802.11 RF channel.
Show Performance Distribution of Aps in Selected Site
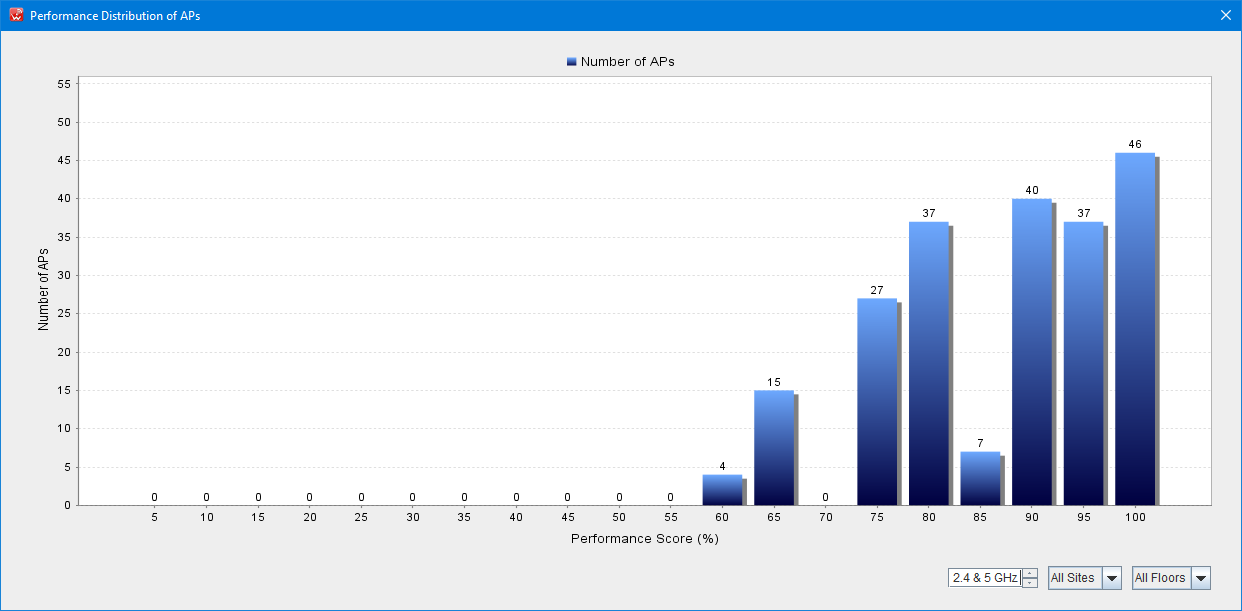
The bar chart shows the distribution of the number APs in ranges of performance scores.
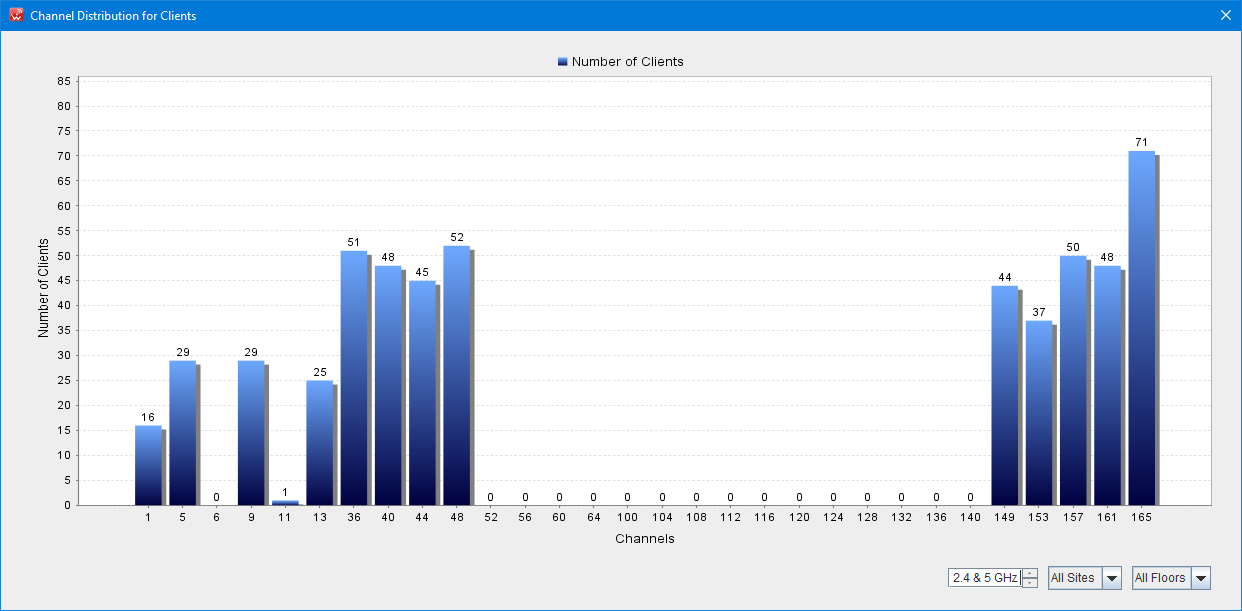
Show Channel Distribution of Clients in Selected Site
The bar chart shows the distribution of the number Client devices in each 802.11 RF channel.
Show Performance Distribution of Alerts in Selected Site
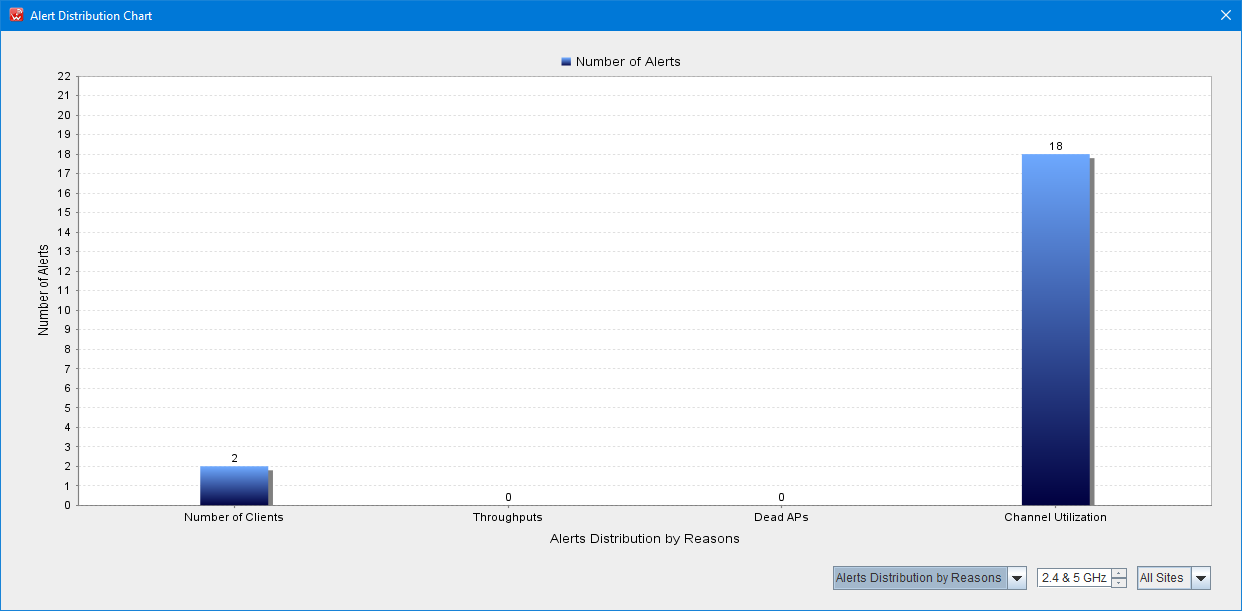
The bar chart shows the distribution of various types of performance alerts.
|