|
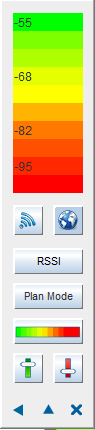
Heat Map Indicator
Heat Map Indicator shows the color scheme and configuration of the heat map on the deployment, users can click on the buttons in the indicator, and set in different view for the heat map as below:
Up-link view and down-link view
 
This is a toggle button, which can be triggered on click to switch between up-link and down-link view for heat map.
Single AP or Floor Map View
 
This is a toggle button, which can be triggered on click to switch between Selected AP or whole floor map view for Wi-Fi performance visualization.
Heat map types
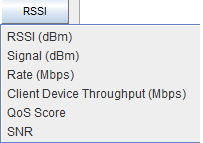
When RSSI button is clicked, the drop down menu shows up to select a type of heat map for showing WLAN performance.
Heat map color scheme
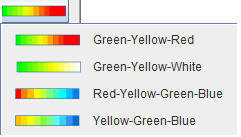
We have four different color scheme for the heat map. user can select it by clicking on the color button, and select one from drop down menu.
Adjust max value and min value
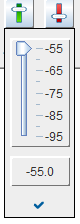
The button with a green vertical bar at left of side is for adjusting max value of heat map, the one with a red bar at right is for min value. When it is clicked, the drop down panel with a slide bar displays, users can move down or up for the slide bar to adjust value as it be allowed.
Heat map plan mode
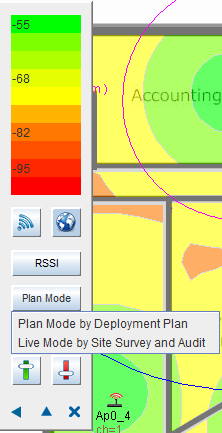
Show heat map with Plan Mode and Live Mode
|